Macro Risk Monitor · 3/4
Model Validation
Key points
- The objective macro pressure measure is related to consumer sentiment and inflation. No relation to later financial stress could be confirmed.
- Judgment scores in September 2026 exceed March 2022, but the objective measure does not.
- The hypothesis that financial strength explains the lack of transmission is unresolved, and we hold it with low confidence.
Contents
Retroactive scoring of five episodes
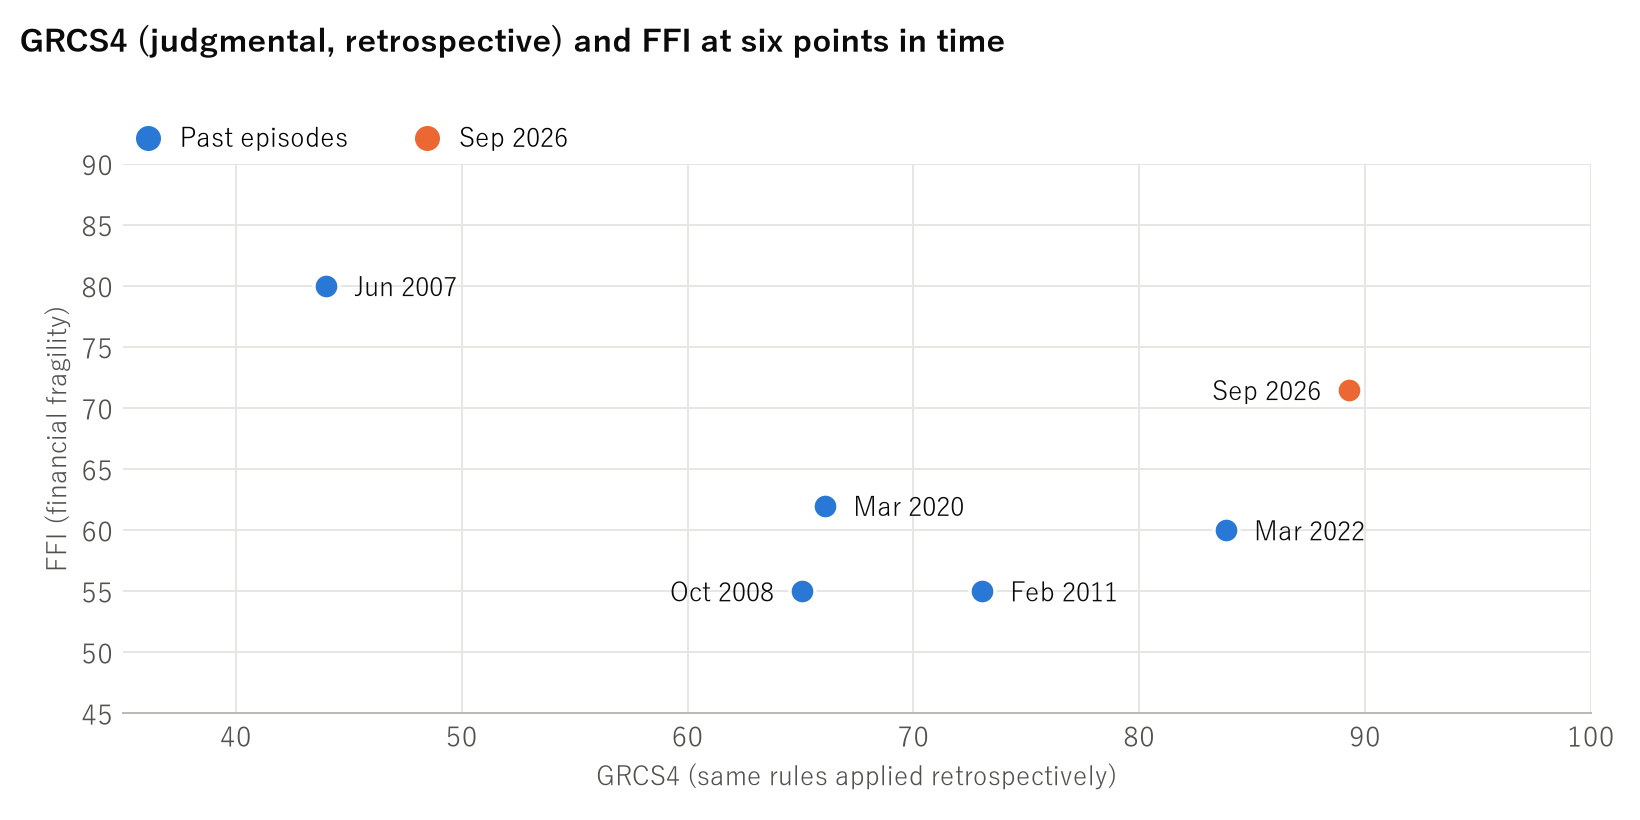
We rescored past periods under the same rules. All are retroactive and are not official index values of the time. Some raw data are approximate.
| Date | Character | GRCS5 | GRCS4 | FFI | FCO | SURI≥60 | RCEI | Regime | proxy-GRCS (percentile) |
|---|---|---|---|---|---|---|---|---|---|
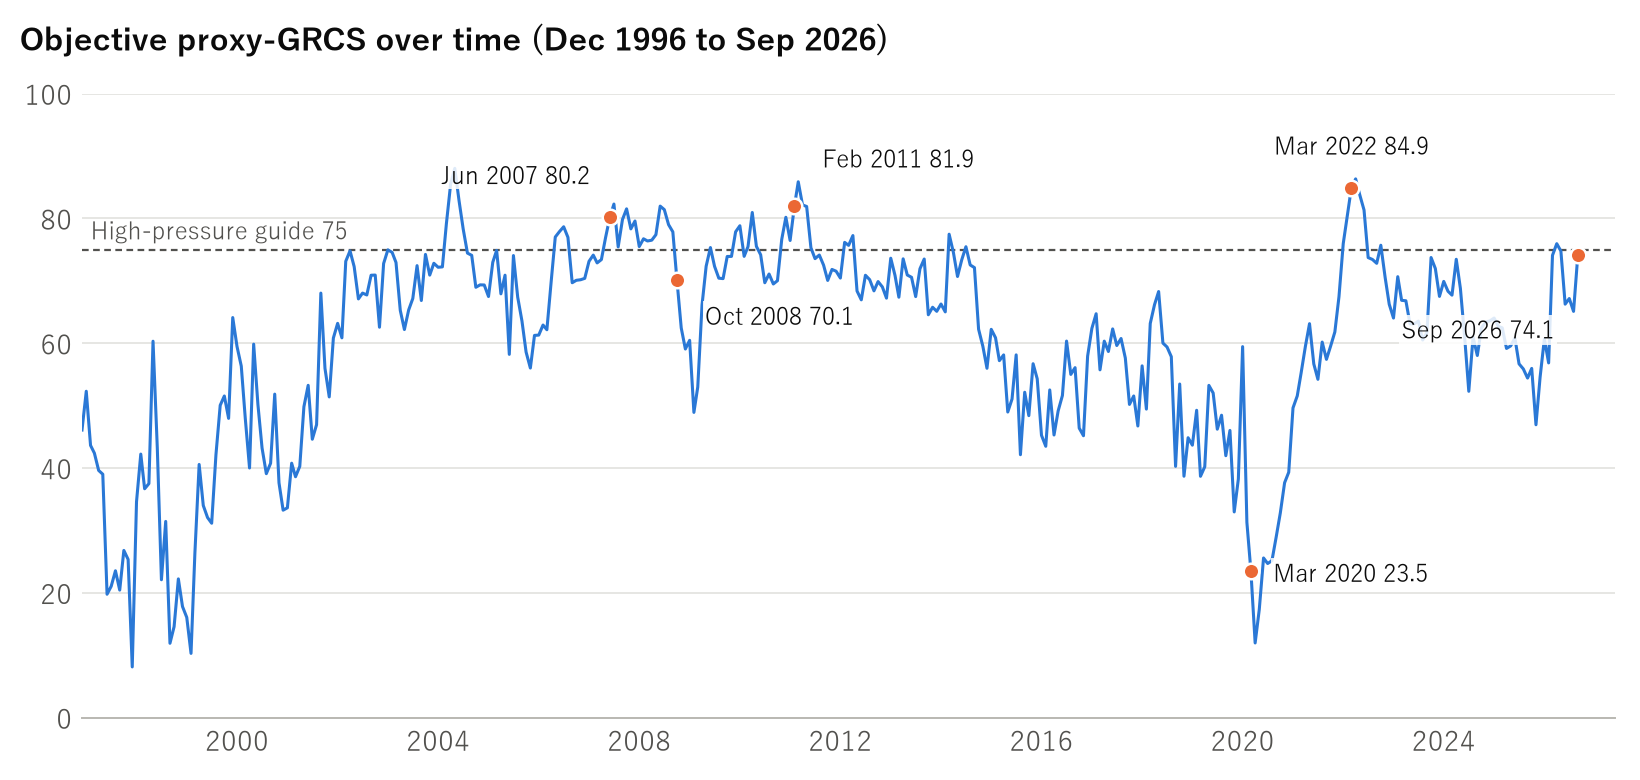
| June 2007 | Pre-crisis calm | 38.96 | 44.00 | 80.00 | 5.69 | 4 | 45.0 | Normal | 80.2 (95.0) |
| October 2008 | Lehman failure | 57.76 | 65.05 | 55.00 | 95.58 | 8 | 50.0 | Financial-Led Crisis | 70.1 (66.2) |
| February 2011 | Arab Spring and high food prices | 64.56 | 73.05 | 55.00 | 12.40 | 11 | 62.0 | Elevated Macro Stress | 81.9 (97.2) |
| March 2020 | COVID | 61.00 | 66.10 | 62.00 | 62.11 | 7 | 55.0 | Financial Stress | 23.5 (4.2) |
| March 2022 | Invasion of Ukraine | 77.52 | 83.85 | 60.00 | 21.18 | 12 | 70.0 | Compound Macro Stress | 84.9 (98.9) |
| September 2026 | Present | 85.70 | 89.28 | 71.45 | 5.34 | 12 | 80.7 | Compound Macro Stress / Latent Fragility | 74.1 (82.4) |
The regime applies the current rule.
| Date | VIX | HY OAS (%) | FAO | Brent ($) | 30-year (%) |
|---|---|---|---|---|---|
| June 2007 | 16.2 | 2.4 | 100 | 71 | 5.1 |
| October 2008 | 61.2 | 16 | 110 | 72 | 4.2 |
| February 2011 | 18.4 | 4.6 | 137.6 | 104 | 4.6 |
| March 2020 | 57.7 | 8.8 | 96 | 32 | 1.5 |
| March 2022 | 27.8 | 3.9 | 160.2 | 118 | 2.4 |
| September 2026 | 16.34 | 3.12 | 136 | 116.8 | 5.37 |
What this shows.
- Judgment scores exceed March 2022, but the objective measure does not reach it.
- The gap between GRCS4 and FCO stays high in 2026. It is only the difference between two separate series, and we do not read it as urgency.
- FCO alone misses June 2007, which is why we added FFI.
- The product of FFI and GRCS4 is also the highest of all episodes, but we withdrew the proposal to use it as a warning indicator.
Judgment and objective measures also differ widely in both directions. June 2007 is 80.2 objective and 44 judgment. March 2020 is 23.5 objective and 66.1 judgment. The four objective axes capture sudden demand shocks poorly, and judgment scores may underweight the financial worries of the time.
Full test of 356 months
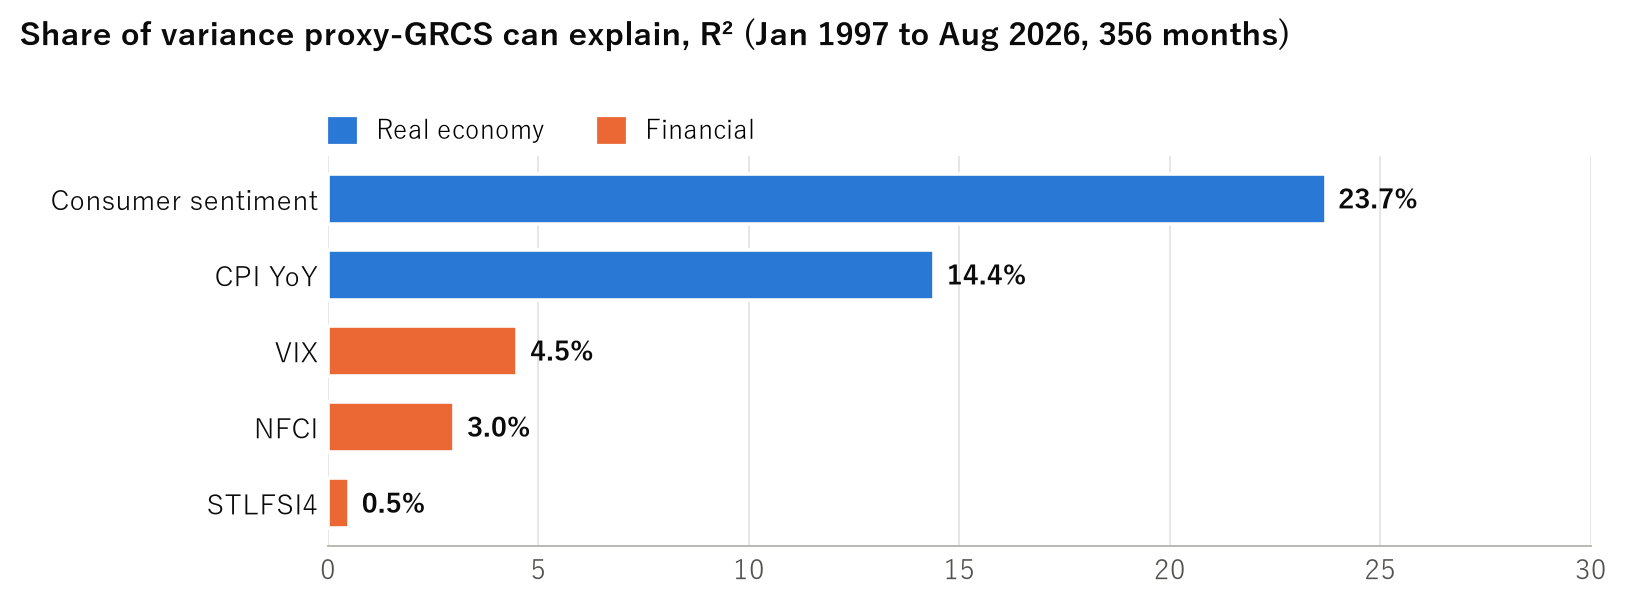
Design. For the 356 months from January 1997 to August 2026, we tested whether proxy-GRCS explains later financial and real indicators, with leads of 0 to 24 months. P-values come from a 24-month circular block bootstrap (2,000 replications). The test ran on September 14, 2026 on data from before the source unification, and it has not been re-run.
| Series | h=0 | h=3 | h=6 | h=12 | h=18 | h=24 |
|---|---|---|---|---|---|---|
| STLFSI4 | −0.07 (0.64) | +0.03 (0.86) | +0.07 (0.70) | +0.05 (0.77) | +0.01 (0.97) | −0.04 (0.81) |
| NFCI | +0.04 (0.82) | +0.12 (0.48) | +0.17 (0.37) | +0.15 (0.49) | +0.11 (0.57) | +0.05 (0.76) |
| VIX | −0.20 (0.14) | −0.13 (0.37) | −0.09 (0.55) | −0.12 (0.44) | −0.20 (0.18) | −0.21 (0.15) |
| CPI y/y | +0.29 (0.12) | +0.26 (0.20) | +0.19 (0.34) | −0.05 (0.78) | −0.22 (0.17) | −0.38 (0.04) |
| Consumer sentiment | −0.48 (0.01) | −0.49 (0.01) | −0.48 (0.01) | −0.46 (0.01) | −0.39 (0.05) | −0.30 (0.14) |
Correlation (p-value). h is the lead in months.
| Series | R² (%) | Lead months |
|---|---|---|
| Consumer sentiment | 23.7 | 3 |
| CPI y/y | 14.4 | 24 |
| VIX | 4.5 | 24 |
| NFCI | 3.0 | 6 |
| STLFSI4 | 0.5 | 6 |
The VIX's 4.5% has the opposite sign.
| Axis | STLFSI4 | NFCI | VIX | CPI | Sentiment |
|---|---|---|---|---|---|
| Food | −0.03 | +0.11 | −0.16 | +0.16 | −0.45 |
| Fiscal | +0.01 | +0.04 | +0.07 | +0.15 | −0.20 |
| Energy | 0.00 | +0.09 | −0.14 | +0.25 | −0.20 |
| Geopolitics | −0.18 | −0.17 | −0.20 | +0.18 | −0.27 |
| Composite | −0.07 | +0.04 | −0.20 | +0.29 | −0.48 |
Contemporaneous correlation by axis.
| Probability within the next 18 months (%) | Unconditional | G≥70 (120 months) | G≥80 (19 months) |
|---|---|---|---|
| STLFSI4 above 0.75 | 46.7 | 49.2 | 57.9 |
| VIX above 30 | 50.0 | 56.7 | 84.2 |
| Inflation accelerates | 65.1 | 65.8 | 47.4 |
| Households worsen | 59.8 | 50.8 | 36.8 |
The 19 months at G≥80 cluster in three periods (2004, 2011, 2022), so there are few independent observations.
| Period | STLFSI h=0 | h=12 | NFCI h=0 | h=12 | VIX h=0 | h=12 | n |
|---|---|---|---|---|---|---|---|
| Pre-regulation, Jan 1997 to Jun 2007 | −0.33 (0.28) | −0.26 (0.33) | −0.46 (0.12) | −0.15 (0.59) | −0.48 (0.08) | −0.48 (0.06) | 126 |
| Crisis, Jul 2007 to Dec 2009 | −0.61 (0.12) | +0.51 (0.15) | −0.74 (0.06) | +0.51 (0.17) | −0.77 (0.04) | +0.45 (0.16) | 30 |
| Post-regulation, Jan 2010 to Aug 2026 | −0.27 (0.07) | −0.03 (0.86) | −0.05 (0.80) | +0.11 (0.60) | −0.12 (0.42) | −0.13 (0.51) | 199 |
Correlation by period (p-value). Pre- and post-regulation refer to the periods before and after the tightening of rules that followed the financial crisis.
| Date | Fed lending ($ billion) | Intervention stress | STLFSI4 | NFCI | VIX |
|---|---|---|---|---|---|
| June 2007 | 0.9 | 0 | — | — | — |
| October 2008 | 441.4 | 100 | +8.50 | +2.50 | 61.2 |
| February 2011 | 22.6 | 21 | — | — | — |
| March 2020 | 109.1 | 63 | +3.98 | +0.09 | 57.7 |
| March 2022 | 27.9 | 27 | — | — | — |
| March 2023 | 354.2 | 94 | +0.12 | −0.18 | 21.6 |
| March 2024 | 172.5 | 75 | — | — | — |
| August 2026 | 5.7 | 0 | — | — | — |
Compares dates of notable Fed lending with market indicators. A dash marks a date not compared. March 2024 is a false positive caused by BTFP arbitrage. It shows that high Fed lending does not always mean market strain.
Conclusion. For real-economy, social and supply-chain risk, explanatory power of 23.7% for consumer sentiment and 14.4% for CPI supports a relation. For financial crises, it is only 0.5% for STLFSI4 and 3.0% for NFCI, and we found no evidence of a relation.
Caveats.
- We did not prove there is no relation. The accurate statement is that we found no evidence of one.
- proxy-GRCS is a stand-in and excludes ① climate and ⑤ AI.
- There are about eight independent events. The data lean toward the US. HY OAS is not used. CPI for October 2025 is interpolated.
- The most important blind spot is the dependent variable. Financial stress indexes observe markets after intervention, so they miss strain that intervention suppressed. Only the Fed is covered.
Gap between judgment and objective measures
| 2026 | GRCS4 (judgment) | proxy-GRCS (objective) | Percentile | Gap |
|---|---|---|---|---|
| Jan | 50.77 | 60.7 | 42.5 | −9.9 |
| Feb | 57.07 | 56.8 | 34.1 | +0.2 |
| Mar | 73.15 | 74.1 | 81.6 | −0.9 |
| Apr | 79.14 | 76.0 | 88.0 | +3.2 |
| May | 82.01 | 74.8 | 84.4 | +7.2 |
| Jun | 83.23 | 66.3 | 55.6 | +17.0 |
| Jul | 84.31 | 67.2 | 57.5 | +17.2 |
| Aug | 87.01 | 65.1 | 53.4 | +21.9 |
| Sep | 89.28 | 74.1 | 82.4 | +15.2 |
The objective measure has two peaks: March to May (percentile 82 to 88) and September (82), with June to August in the middle (53 to 58). Judgment scores have risen every month since January. This difference in shape suggests a possible upward bias in our judgment scores.
On the September value. The 76.3 (88.5th percentile) at creation used World Bank Brent, a preliminary GPR and August CPI, so September alone mixed sources. Unifying the full period on IMF data gives 74.1 (82.4th percentile). The gap moves from the initial +13.0 to +15.2, above the ±15 criterion. We will review the scoring criteria in the next report.
Hypothesis under test
We are testing the following hypothesis about 2026. It is not a conclusion.
"The macro shock has begun to reach financial asset prices through the interest rate channel but has not reached the functions of the financial system. The latter likely reflects the capital and liquidity of financial institutions, but risks that price indexes capture poorly, namely borrower leverage and unrealized losses on bank bond holdings, are building up."
| Hypothesis | Statement | Current status |
|---|---|---|
| H1 | Macro pressure is rising | Supported on judgment. The objective measure rose again but only to March-May levels, near the high-pressure threshold |
| H2 | It has not reached finance | Supported for plumbing and credit conditions. The price layer began to give way in September for the first time |
| H3 | The reason is financial strength | Unresolved, low confidence |
| Competing explanation | Content | Evidence and counter-evidence |
|---|---|---|
| A. True resilience | Capital and liquidity are thick | CET1 rose from 7% in 2007 to 13%. SVB is a counterexample |
| B. Dependence on intervention | Strain is held down by intervention | March 2020 and March 2023 (Fed lending of $354.2 billion). $8.8 billion in September 2026 is normal |
| C. Risk shift and missed measurement | Risk moved where indexes do not show it | Opaque assets 73, CCC spread 968bp, unrealized losses on held-to-maturity bonds |
| D. Weak causality | The link is weak to begin with | Correlation is about 0, also before regulation |
| Outcome | Reading |
|---|---|
| Only P-18 | Supports the refined hypothesis |
| P-16 as well | Strength depended on intervention (B) |
| P-17 | Revise the core of the hypothesis (counter to A) |
| Nothing happens | Consistent with the hypothesis, but A and D cannot be told apart |
P-16: SOFR−IORB at +10bp or more, or Fed lending at $50 billion or more. P-17: weekly NFCI above 0 (−0.548 at end-September). P-18: weekly STLFSI4 above 0 (−0.81 at end-September). All are due by the end of March 2027.
Financial indicators in high-pressure months differ before and after regulation. After regulation, STLFSI4 exceeded 0 in all 24 high-pressure months, but the NFCI composite exceeded 0 in none. This is a reference comparison only. There are effectively four periods after regulation. The aggregation also uses the series at creation, and we will update it in the next report along with the September recalculation.
| Indicator | Post, high pressure | All | Share >0 | All | Pre, high pressure | All | Share >0 | All |
|---|---|---|---|---|---|---|---|---|
| STLFSI4 | +0.54 | +0.14 | 100 | 75 | −0.47 | +0.56 | 27 | 72 |
| VIX | +30.01 | +24.75 | — | — | +17.27 | +27.16 | — | — |
| NFCI risk | −0.10 | −0.47 | 17 | 9 | −0.48 | −0.36 | 27 | 29 |
| NFCI credit | +0.10 | +0.06 | 92 | 74 | −0.04 | +0.19 | 36 | 62 |
| NFCI leverage | +0.41 | +0.13 | 92 | 70 | +0.08 | 0.00 | 73 | 50 |
| NFCI composite | −0.11 | −0.35 | 0 | 7 | −0.50 | −0.33 | 27 | 29 |
Median, and share of months above 0 (%). Post-regulation is January 2010 to September 2025 with n=24. Pre-regulation is January 1997 to June 2007 with n=11.
If transmission does occur, a likely order is energy, inflation, rate hikes, long yields, unrealized bank bond losses and deposit flight. From the start of rate hikes in 2022 to the failure of SVB took about 12 months. We treat the next 12 months as the test period.
Items updated monthly
- proxy-GRCS and its gap with judgment. Above ±15, we review the scoring criteria.
- The three rate-channel series (SOFR−IORB, NFCI composite, Fed lending) and quarterly FDIC data.
- Prediction judgments and the cumulative Brier score. An annual validation is published each January.
- The full test is re-run in the annual validation.