Macro Risk Monitor: September 2026 Final (MR-2026-09)
How to read this. This report uses data as of October 6, 2026. Published reports are not rewritten; corrections are recorded in later issues.
proxy-GRCS was first calculated at 76.3 (88.5th historical percentile). For publication we recalculated it using one source across the full period and show 74.1 (82.4th percentile). The difference is explained under Judgmental and objective compared.
Conclusions of this report
- Prices moved together for the first time in 2026. On September 16 the FOMC raised rates for the first time since 2023 (+25bp, to 3.75-4.00%) and signaled one more hike this year. US HY OAS widened from 2.63% to 3.12% and the EM spread proxy from 290bp to 319bp. The 10-year term premium passed 1% for the first time, at 1.02%. The 30-year Treasury ended the month at 5.64%. Even so, FCO rose only from 3.27 to 5.34 and stays in the Low band.
- Financial functions remain normal. SOFR−IORB was 0bp at month-end, the monthly peak in Fed lending was $8.8 billion, NFCI overall was −0.56 and STLFSI4 was −0.79. We see no strain in funding, credit supply or settlement.
- Macro pressure rose again. GRCS5 rose from 83.44 to 85.70 and GRCS4 from 87.01 to 89.28. The objective proxy-GRCS also returned from 65.1 to 74.1, or from the 53.4th to the 82.4th percentile. The gap between judgmental and objective is +15.2, beyond the ±15 review threshold.
- Effects are visible in food and social unrest. The FAO Food Price Index is 136.0 and the Cereal Index is 122.8. Countries with SURI ≥ 60 rose from 10 to 12. The two additions only just cross the line, at 60.75 for Bangladesh and 60.05 for Peru.
- Three predictions were hits: P-02, P-11 and P-15. All five judged so far are hits, but the average Brier score is 0.338, worse than the coin-flip value of 0.25, because low probabilities were placed on those hits.
Contents
Where we stand
| Index | What it measures | This month | Prior month | Change | Band |
|---|---|---|---|---|---|
| GRCS5 | Compound macro pressure (five risks) | 85.70 | 83.44 | +2.26 | Severe |
| GRCS4 | For comparison across eras (excludes ⑤ AI) | 89.28 | 87.01 | +2.27 | Severe |
| FFI | Financial fragility (weakness built up in calm times) | 71.45 | 71.10 | +0.35 | High |
| FCO | Financial stress (tension occurring now) | 5.34 | 3.27 | +2.07 | Low |
| SCI | Strength of the chains | 82.00 | 78.80 | +3.20 | — |
| SURI≥60 | Countries with social unrest risk of 60 or more (of 20) | 12 | 10 | +2 | — |
| RCEI | Regional conflict escalation | 80.70 | 77.85 | +2.85 | Severe |
Bands are thresholds set for each index. See The Risk Measurement Model for definitions.
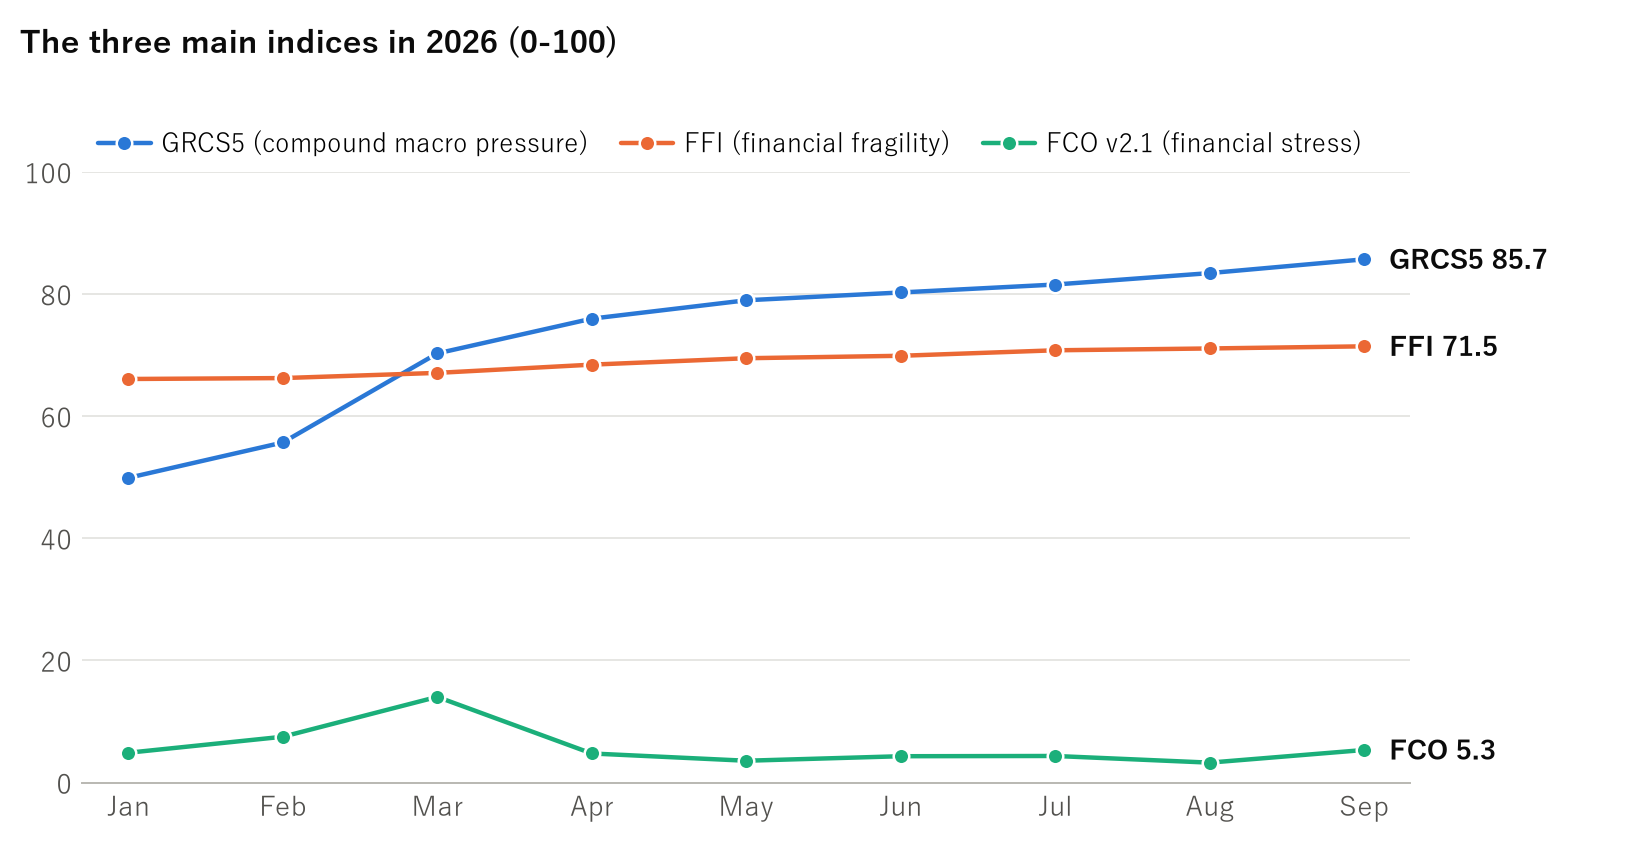
The point to note is that the price layer alone has moved for the first time, while high macro pressure and low financial stress continue side by side. The move was not large enough to change the FCO band.
Regime reading
The regime for September is Compound Macro Stress / Latent Fragility. It meets the conditions of GRCS5 at 75 or more, FFI at 65 or more and FCO below 30. This reading has held since April, 6 months in a row.
| Month | GRCS5 | FFI | FCO | Regime |
|---|---|---|---|---|
| Jan | 49.91 | 66.10 | 4.89 | Normal |
| Feb | 55.70 | 66.25 | 7.51 | Elevated Macro Stress |
| Mar | 70.29 | 67.10 | 14.04 | Elevated Macro Stress |
| Apr | 75.98 | 68.45 | 4.77 | Compound Macro Stress / Latent Fragility |
| May | 78.99 | 69.50 | 3.58 | Compound Macro Stress / Latent Fragility |
| Jun | 80.27 | 69.90 | 4.32 | Compound Macro Stress / Latent Fragility |
| Jul | 81.57 | 70.80 | 4.36 | Compound Macro Stress / Latent Fragility |
| Aug | 83.44 | 71.10 | 3.27 | Compound Macro Stress / Latent Fragility |
| Sep | 85.70 | 71.45 | 5.34 | Compound Macro Stress / Latent Fragility |
The five major risks
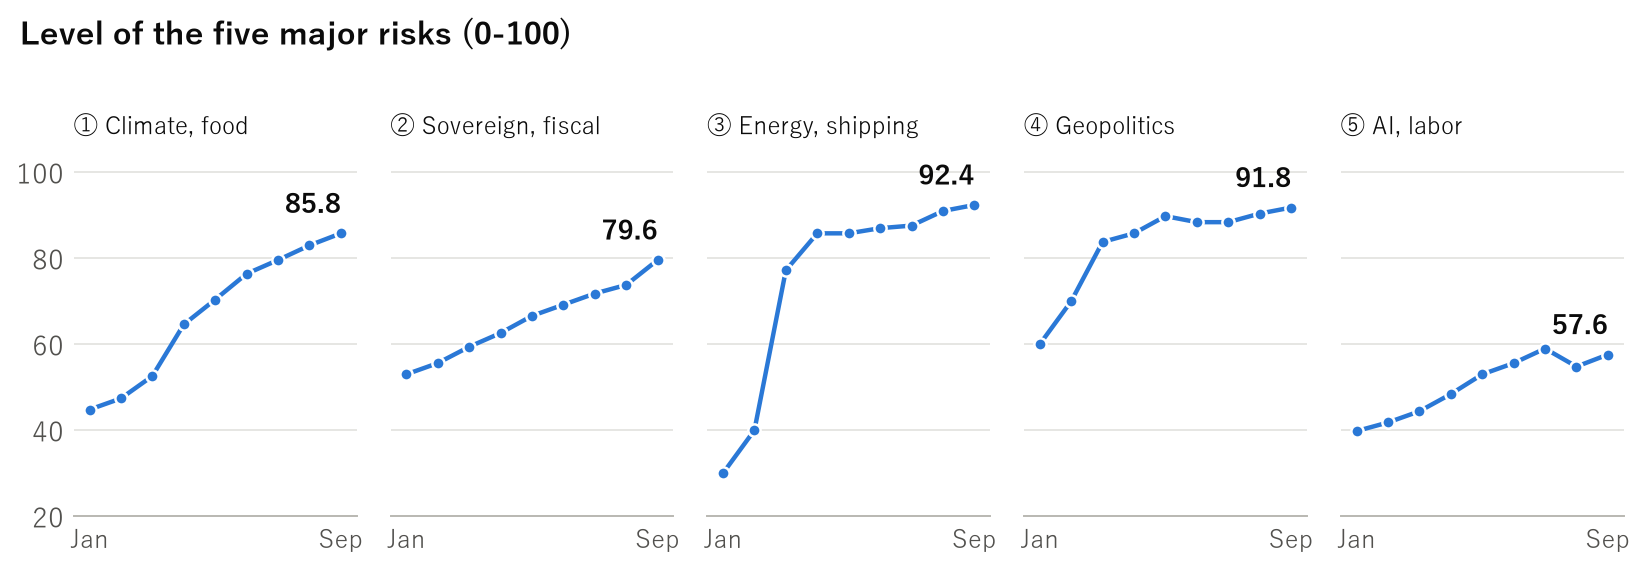
| Risk | M | L | Level | Change | D |
|---|---|---|---|---|---|
| ① Climate, food, water | 4.2 | 4.5 | 85.8 | +2.8 | +1 |
| ② Sovereign, fiscal | 3.8 | 4.4 | 79.6 | +5.8 | +1 |
| ③ Energy, shipping | 4.5 | 4.9 | 92.4 | +1.4 | +1 |
| ④ Politics, geopolitics | 4.5 | 4.8 | 91.8 | +1.4 | +1 |
| ⑤ AI, labor | 3.0 | 2.6 | 57.6 | +2.8 | +1 |
M is the level this month and L is the degree of linkage (each 1-5). Level = (0.7M + 0.3L) × 20. D is direction (−2 to +2) and is not part of the score.
Why the scores moved
- ① Climate, food, water: The FAO Food Price Index rose 1.5% to 136.0 and cereals rose 5.1%. Wheat reached its highest level since August 2023. We raised M from 4.0 to 4.2.
- ② Sovereign, fiscal: The FOMC raised rates. The 30-year Treasury averaged 5.37% and ended at 5.64%, and the term premium passed 1% for the first time. We raised M from 3.6 to 3.8, and L from 3.9 to 4.4 under the new rule (see the revision record).
- ③ Energy, shipping: Brent rose 28.5% to $116.8 and European gas rose 20.4% to $25.42. Transits recovered to about 13 per day, but eight merchant ships were hit at month-end. We raised M from 4.4 to 4.5.
- ④ Politics, geopolitics: A crew member died in the attacks on merchant ships from September 23, and the US administration rejected Iran's proposal to reopen the strait. GPR rose from 125.6 to 146.2. We raised M from 4.4 to 4.5.
- ⑤ AI, labor: The share of job cuts attributed to AI rose from 6.5% to 9.2%, and tech-sector cuts rose 77%. AI ranks fifth among reasons and has not returned to first. We raised M from 2.8 to 3.0.
Volume and price at Hormuz moved in opposite directions. Weekly transits recovered to 82 and 95, and crude flows were about 7.4 million b/d, about 40% of the prewar level of about 20 million b/d. Brent still rose sharply, ending the month near $107.
Main real-economy indicators
| Indicator | Prior month | This month |
|---|---|---|
| Global temperature anomaly (°C) | 0.85 | 0.82 |
| FAO Food Price Index | 134.0 | 136.0 |
| FAO Cereal Price Index | 116.8 | 122.8 |
| Brent crude ($) | 90.9 | 116.8 |
| European gas ($/MMBtu) | 21.11 | 25.42 |
| Hormuz transits (per day, press estimates) | 5 | 13 |
| Share of job cuts attributed to AI (%) | 6.5 | 9.2 |
Brent and European gas are World Bank monthly averages. FAO values are as published when each report was prepared; later revisions are in the revision record.
Three-layer check of financial contagion
We check financial contagion in three layers: price, credit and leverage, and plumbing. This month the three layers gave different results.
The price layer moved. The widening in HY OAS came mostly after 2.73% on September 23. HY issuance of $38.5 billion was the largest of the year, and CCC spreads of 968bp were the widest since November 2023. Poor digestion of new supply and selection by quality appear to be behind this.
The credit and leverage layer stays loose. NFCI credit is −0.06 and NFCI overall is −0.56. However, NFCI nonfinancial leverage keeps rising, to −0.47, which is the 93rd percentile since 2010.
The plumbing layer is normal. SOFR−IORB is 0bp and Fed lending is $8.8 billion, with no strain visible after the hike.
| Layer | Indicator | Prior month | This month |
|---|---|---|---|
| Price layer | US HY OAS (%, month-end) | 2.63 | 3.12 |
| Price layer | EM spread proxy (bp) | 290 | 319 |
| Price layer | VIX (month-end) | 14.92 | 16.34 |
| Price layer | STLFSI4 | −0.81 | −0.79 |
| Price layer | 30-year Treasury (%, monthly average) | 5.22 | 5.37 |
| Price layer | 10-year term premium (%) | 0.88 | 1.02 |
| Price layer | Dollar index proxy | 118.57 | 120.97 |
| Credit and leverage layer | NFCI overall | −0.55 | −0.56 |
| Credit and leverage layer | NFCI credit | −0.06 | −0.06 |
| Credit and leverage layer | NFCI leverage | 0.10 | 0.08 |
| Credit and leverage layer | NFCI nonfinancial leverage | −0.49 | −0.47 |
| Credit and leverage layer | Bank lending standards (net tightening %) | 0.0 (July survey) | 0.0 (July survey) |
| Plumbing layer | SOFR−IORB (bp) | +3 | 0 |
| Plumbing layer | Monthly peak in Fed lending ($ billion) | 5.7 | 8.8 |
STLFSI4 and the NFCI series have an average of 0; negative readings are looser than average. The EM spread and the dollar index are proxy series.
Breakdown of FCO v2.1
| Component | Weight | Source value | Score |
|---|---|---|---|
| Credit (HY OAS) | 0.25 | 3.12% | 7.44 |
| Volatility (VIX) | 0.20 | 16.34 | 8.90 |
| Funding (SOFR−IORB) | 0.15 | 0 bp | 4.00 |
| Banks (lending standards) | 0.15 | Expert judgment | 4.00 |
| Liquidity | 0.10 | Expert judgment | 5.00 |
| Intervention use (Fed lending) | 0.15 | 8.8 | 0.00 |
| FCO | 1.00 | — | 5.34 |
Credit, volatility and intervention use are calculated mechanically. Funding, banks and liquidity are scored by expert judgment. We raised liquidity from 0 to 5 to reflect poor digestion in the HY market.
Breakdown of FFI
| Component | Weight | Prior month | This month |
|---|---|---|---|
| Leverage and credit quality | 0.20 | 73 | 74 |
| Maturity wall | 0.15 | 67 | 69 |
| Valuation and spread compression | 0.20 | 79 | 76 |
| Opaque assets | 0.20 | 73 | 73 |
| Bank lending standards and balance sheets | 0.10 | 57 | 57 |
| External vulnerability (EM) | 0.15 | 69 | 72 |
| FFI | 1.00 | 71.10 | 71.45 |
Leverage and credit quality rose from 73 to 74, the maturity wall from 67 to 69, and external vulnerability from 69 to 72. Valuation fell from 79 to 76 as spreads widened. FFI treats spread compression as adding to fragility, so widening lowers this score.
Social unrest and regional conflict
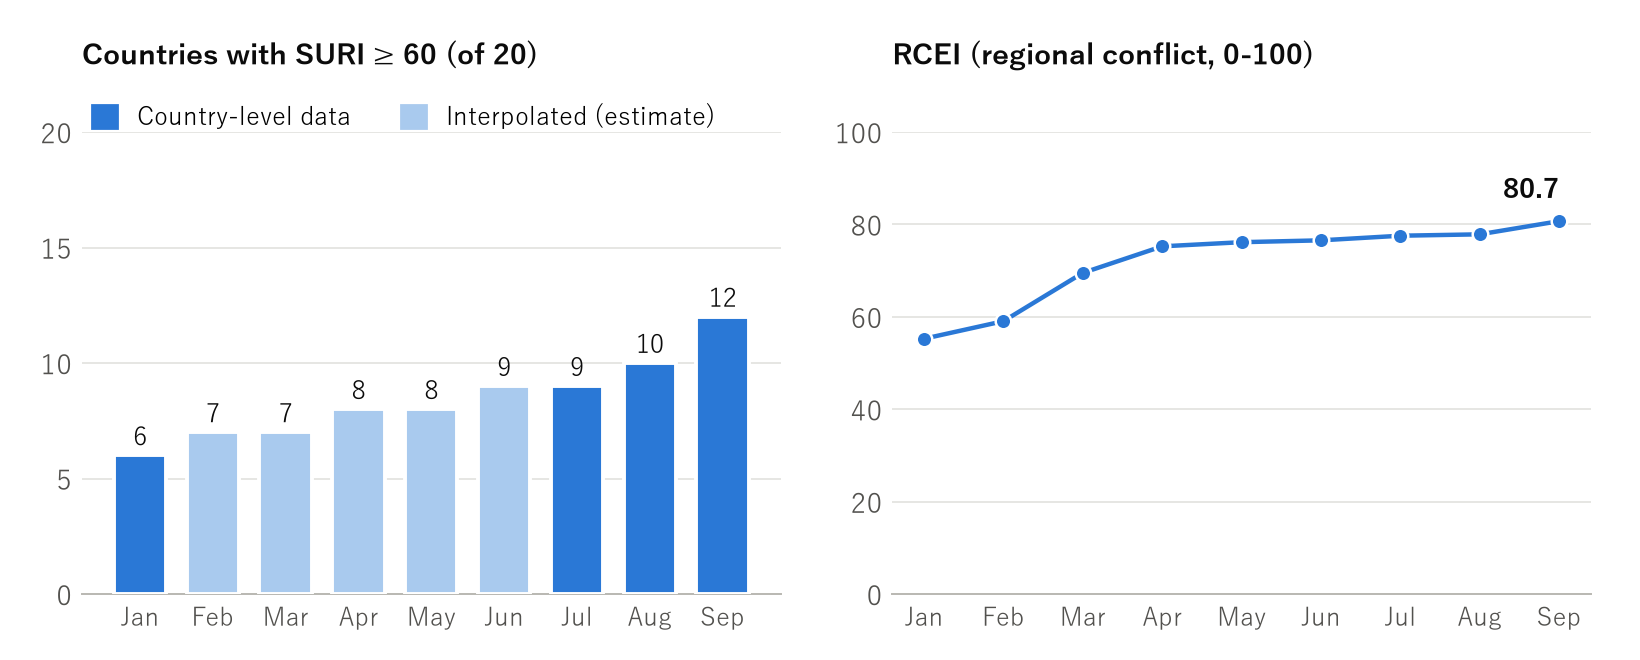
Countries with SURI ≥ 60 rose from 10 to 12. The new ones are Bangladesh (60.75) and Peru (60.05), both barely over the line. Countries at 75 or more stay at five, with Myanmar just below at 74.90. The simple average rose from 62.67 to 63.79 and the population-weighted figure from 63.34 to 64.46. The population-weighted figure exceeds the GDP-weighted one, so pressure is concentrated in populous low-income countries.
This month's scoring added 2 to household stress in all 20 countries, a further 1 in the 13 countries dependent on Black Sea wheat and net fuel imports, 1 to protest in the 6 countries already at 70 or more, 1 to government fragility in the 11 countries dependent on external funding, and 1 to conflict in Lebanon.
RCEI rose from 77.85 to 80.70, led by combat intensity, escalation speed, and food, energy and water.
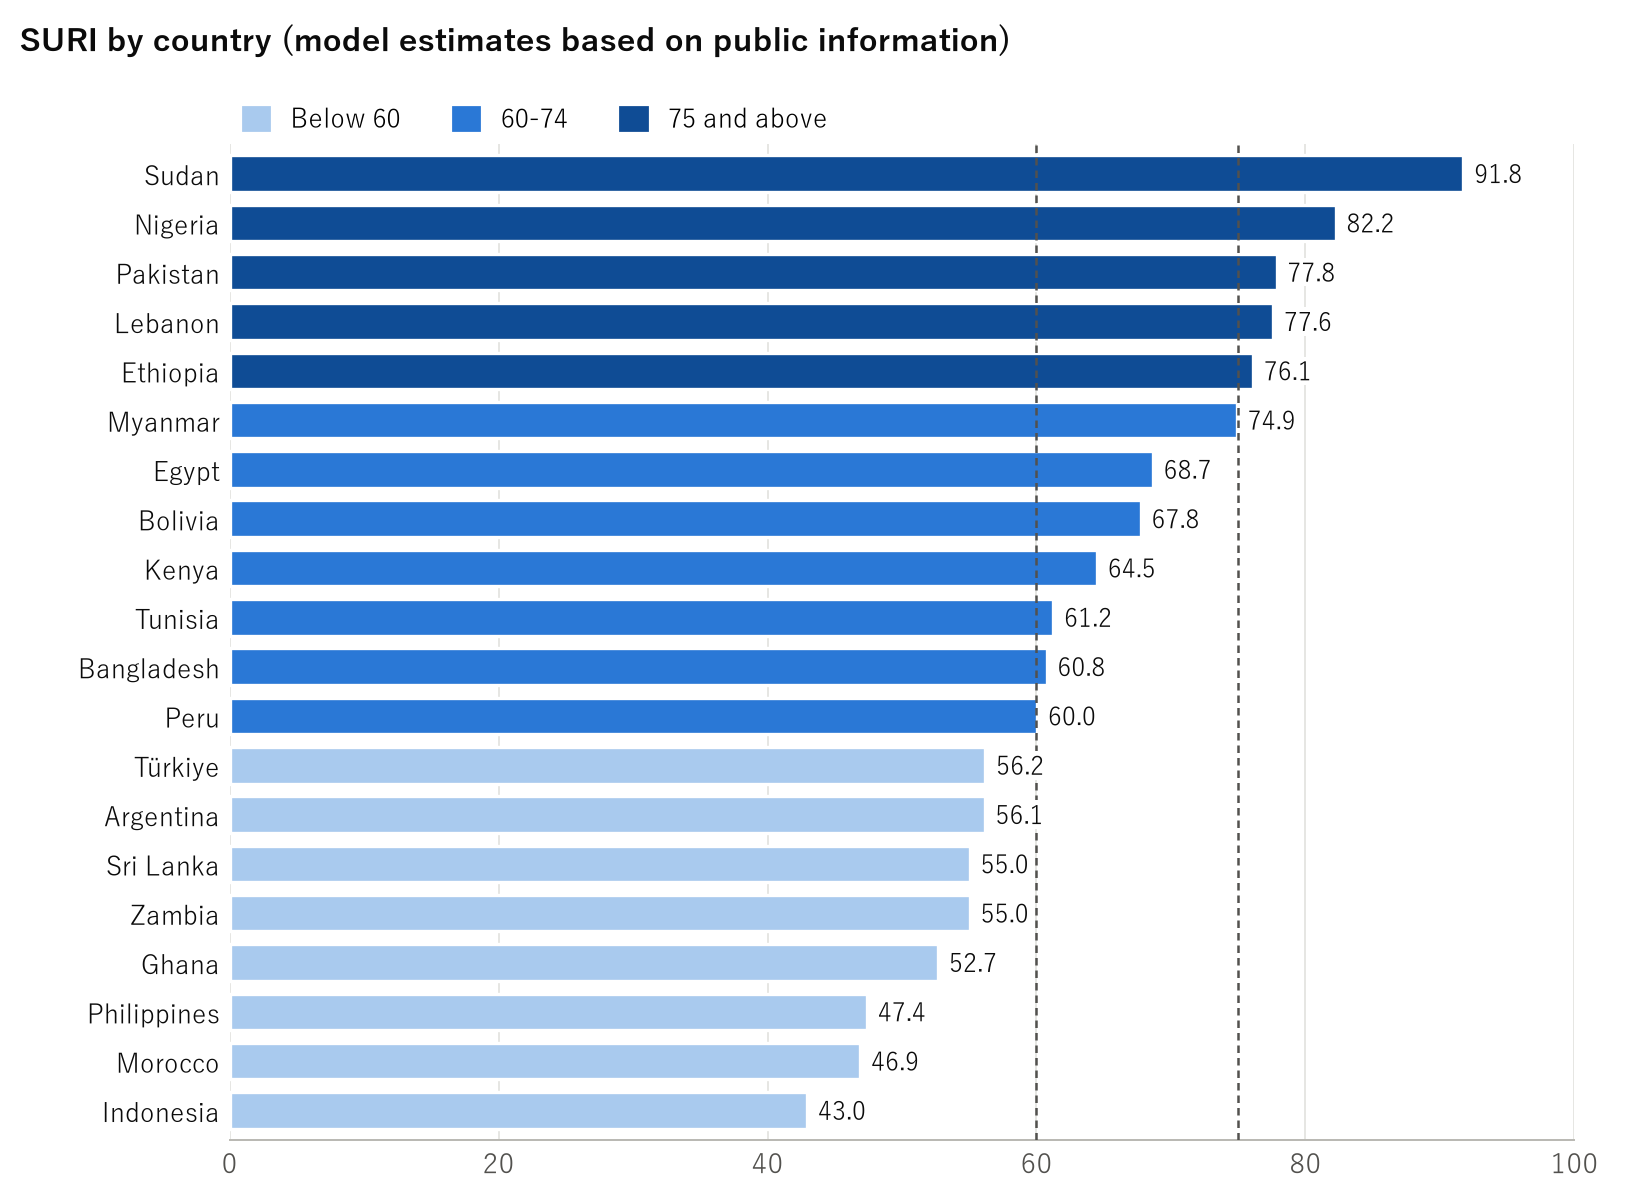
| Country | Household | Protest | Government | Conflict | SURI | Change | Main factors |
|---|---|---|---|---|---|---|---|
| Sudan | 99 | 74 | 95 | 98 | 91.75 | +0.95 | Household stress near its ceiling; the conflict and famine structure is unchanged |
| Nigeria | 91 | 76 | 72 | 85 | 82.25 | +1.50 | Fuel and rice prices stay high and the dollar is stronger; priority monitoring continues |
| Pakistan | 84 | 73 | 73 | 78 | 77.85 | +1.50 | Flour prices stay high after the August fuel protests; external funding costs are rising |
| Lebanon | 86 | 62 | 86 | 74 | 77.60 | +1.25 | Gulf theater re-escalates (merchant ships hit in late September) |
| Ethiopia | 86 | 56 | 75 | 85 | 76.10 | +1.05 | Conflict and drought combined |
| Myanmar | 79 | 45 | 85 | 95 | 74.90 | +0.70 | Continuing civil war; armed conflict is the main channel rather than protest |
| Egypt | 88 | 57 | 71 | 47 | 68.65 | +1.25 | Wheat imports and fuel subsidies strain the budget; the stronger dollar adds pressure again |
| Bolivia | 76 | 83 | 72 | 30 | 67.75 | +1.15 | Protests against fuel subsidy cuts continue |
| Kenya | 76 | 78 | 57 | 35 | 64.50 | +1.50 | Risk that the May fuel protests flare again; stronger dollar |
| Tunisia | 78 | 59 | 66 | 30 | 61.25 | +1.25 | Food import dependence and fragile public finances |
| Bangladesh | 74 | 61 | 58 | 40 | 60.75 | +1.05 | Crosses the threshold at 60.75; energy imports and power cuts |
| Peru | 66 | 75 | 61 | 30 | 60.05 | +0.95 | Crosses the threshold narrowly at 60.05; may prove temporary |
| Türkiye | 74 | 46 | 49 | 45 | 56.20 | +0.90 | Chronic high inflation |
| Argentina | 72 | 63 | 56 | 20 | 56.15 | +0.90 | Austerity and falling real incomes |
| Zambia | 76 | 45 | 61 | 25 | 55.05 | +1.25 | Debt restructuring in progress and drought |
| Sri Lanka | 71 | 56 | 56 | 25 | 55.05 | +1.25 | Risk of a repeat of the 2022 crisis |
| Ghana | 71 | 49 | 53 | 25 | 52.70 | +1.25 | Cost-of-living pressure after debt restructuring |
| Philippines | 61 | 41 | 39 | 40 | 47.40 | +1.05 | Rice prices have become a political issue |
| Morocco | 64 | 46 | 40 | 25 | 46.90 | +1.05 | Lower farm output due to drought |
| Indonesia | 56 | 43 | 33 | 30 | 42.95 | +0.70 | Growing fiscal burden of subsidies |
SURI by country is a set of model estimates based on public information. It is not an official assessment or rating of any country. SURI = 0.35 Household Stress + 0.25 Protest Mobilization + 0.20 Government Fragility + 0.20 Conflict Transmission.
| Month | SURI ≥ 60 | SURI ≥ 75 | Simple average | Population-weighted | GDP-weighted | Maximum | Data |
|---|---|---|---|---|---|---|---|
| Jan | 6 | 1 | 53.15 | 53.38 | 47.80 | 83.20 | Country-level data |
| Aug | 10 | 5 | 62.67 | 63.34 | 56.52 | 90.80 | Country-level data |
| Sep | 12 | 5 | 63.79 | 64.46 | 57.52 | 91.75 | Country-level data |
| Component | Prior month | This month |
|---|---|---|
| Combat intensity | 85 | 87 |
| Escalation speed | 72 | 78 |
| State fragility | 67 | 68 |
| Food, energy, water | 79 | 83 |
| Refugees, cross-border | 83 | 83 |
| RCEI | 77.85 | 80.70 |
Strength of the chains
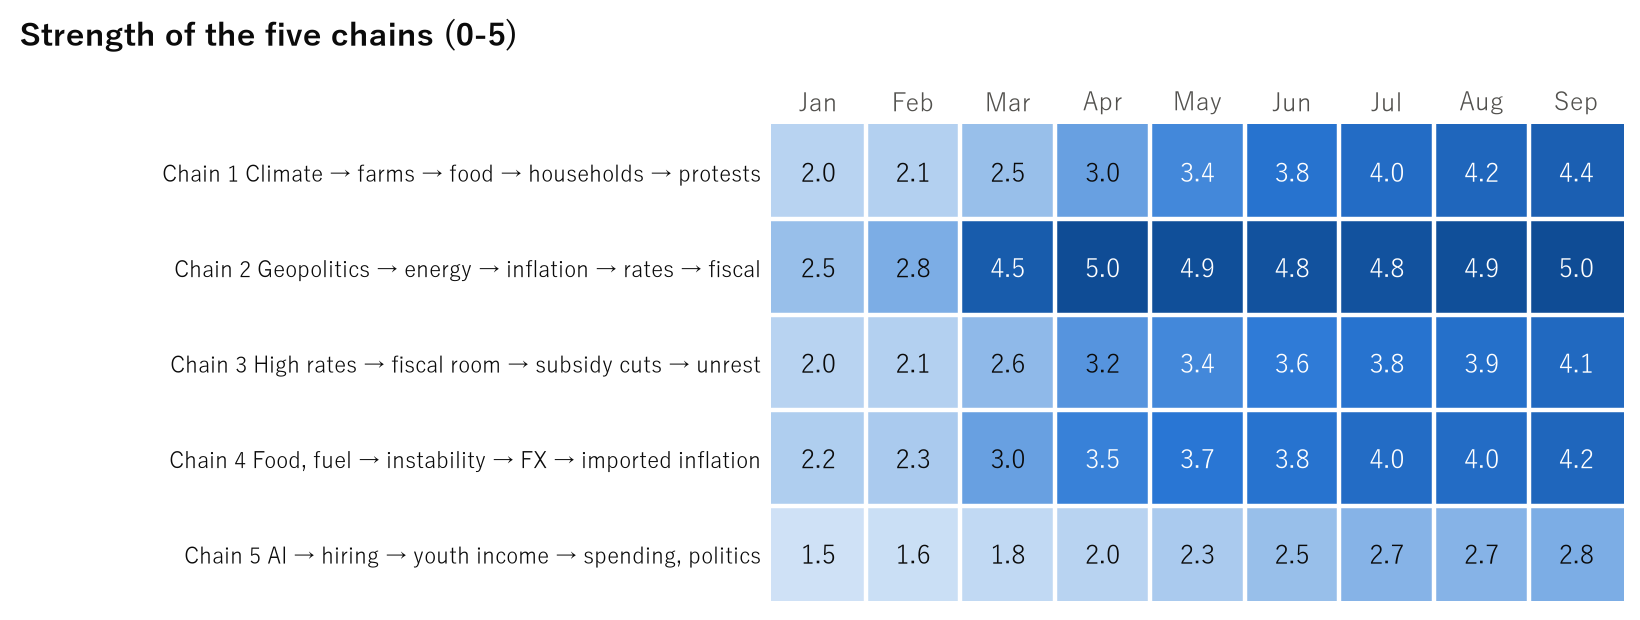
SCI rose from 78.8 to 82.0. Chain 2 reached the ceiling of 5.0 from 4.9, Chain 4 rose from 4.0 to 4.2 and Chain 1 from 4.2 to 4.4. Only Chain 1 has support from 30 years of data; the rest are structural reasoning.
| Chain | Prior month | This month | Change |
|---|---|---|---|
| Chain 1 Climate → farms → food → households → protests | 4.2 | 4.4 | +0.2 |
| Chain 2 Geopolitics → energy → inflation → rates → fiscal | 4.9 | 5.0 | +0.1 |
| Chain 3 High rates → fiscal room → subsidy cuts → unrest | 3.9 | 4.1 | +0.2 |
| Chain 4 Food, fuel → instability → FX → imported inflation | 4.0 | 4.2 | +0.2 |
| Chain 5 AI → hiring → youth income → spending, politics | 2.7 | 2.8 | +0.1 |
| SCI (average of chains × 20) | 78.8 | 82.0 | +3.2 |
Judgmental and objective compared
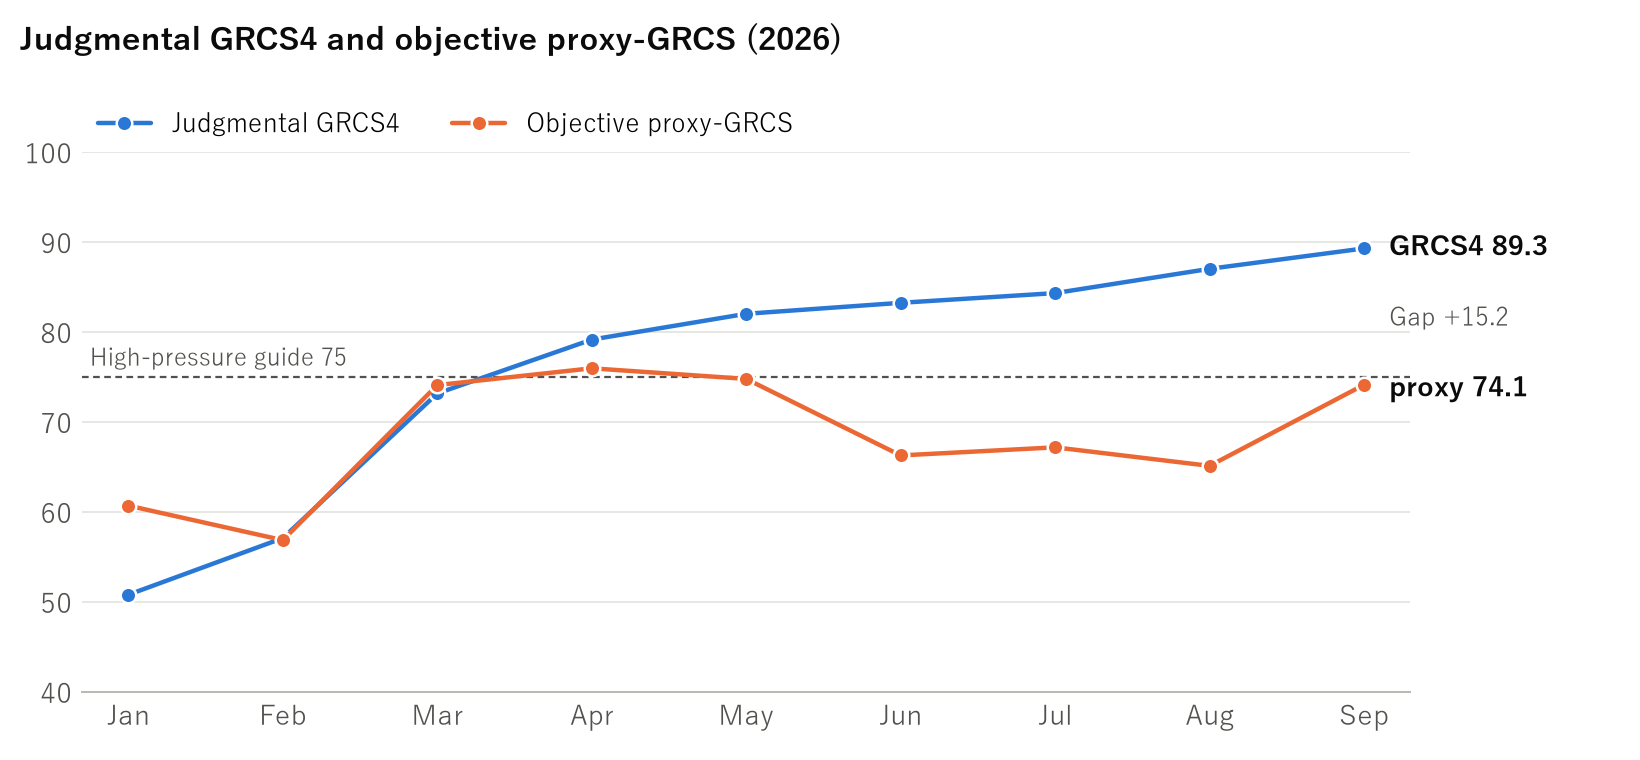
We compare judgmental GRCS4 with proxy-GRCS, calculated mechanically from markets and statistics. September rose on the objective measure too. In percentile terms there are two peaks, March to May (82-88) and September (82), with June to August in the middle (53-58). The judgmental score has risen every month since January. This difference in shape suggests a possible upward bias in judgmental scoring.
| Month | GRCS4 (judgmental) | proxy-GRCS (objective) | Historical percentile | Gap |
|---|---|---|---|---|
| Jan | 50.77 | 60.7 | 42.5 | −9.9 |
| Feb | 57.07 | 56.8 | 34.1 | +0.2 |
| Mar | 73.15 | 74.1 | 81.6 | −0.9 |
| Apr | 79.14 | 76.0 | 88.0 | +3.2 |
| May | 82.01 | 74.8 | 84.4 | +7.2 |
| Jun | 83.23 | 66.3 | 55.6 | +17.0 |
| Jul | 84.31 | 67.2 | 57.5 | +17.2 |
| Aug | 87.01 | 65.1 | 53.4 | +21.9 |
| Sep | 89.28 | 74.1 | 82.4 | +15.2 |
About the unified value. The original 76.3 used the World Bank Brent ($116.8), the preliminary GPR (146.2) and August CPI. The historical series used IMF Brent ($102.02 in September) and a more settled GPR (155.9), so September alone mixed sources. With the IMF source across the full period the value is 74.1 (82.4th percentile). The percentiles of the four axes are food 43.9, fiscal 64.7, energy 73.1 and geopolitics 92.1.
As a result, the gap first stated as +13.0 becomes +15.2 and passes the ±15 threshold. We will review the scoring criteria in the next issue. Also, 74.1 sits just below the 75 guide for high pressure, so statements treating September as a high-pressure month should be read with that caveat.
The hypothesis under test
From this month's results we take up the following hypothesis for testing. It is not a conclusion.
"The macro shock has begun to reach financial asset prices through the interest rate channel but has not reached the functions of the financial system. The latter likely reflects the capital and liquidity of financial institutions, but risks that price indexes capture poorly, namely borrower leverage and unrealized losses on bank bond holdings, are building up."
| Hypothesis | Statement | Current status |
|---|---|---|
| H1 | Macro pressure is rising | Supported on judgment. The objective measure rose again but only to March-May levels, near the high-pressure threshold |
| H2 | It has not reached finance | Supported for plumbing and credit conditions. The price layer began to give way in September for the first time |
| H3 | The reason is financial strength | Unresolved, low confidence |
To tell these apart, we added falsification conditions to the prediction log: P-16 (strain in plumbing), P-17 (NFCI above 0) and P-18 (STLFSI4 above 0). P-18 alone is consistent with the hypothesis. If P-16 also occurs, the strength depended on intervention. If P-17 occurs, the core of the hypothesis needs revision. If nothing happens, the result is consistent, but financial strength cannot be told apart from a weak causal link.
From the start of rate hikes in 2022 to the failure of SVB took about 12 months. We treat the next 12 months as the test period. See Model Validation for details.
Prediction log
Each prediction is recorded with the probability at issue and judged when due. P-16 to P-18 test the hypothesis. A threshold prediction is settled when reached; P-11 stays settled at the time of publication even if a later revision lowers the value.
| ID | Prediction | Probability | Deadline | Status | Issued |
|---|---|---|---|---|---|
| P-01 | Protests over the cost of living or fuel with fatalities occur in at least three countries with SURI ≥ 60 | 0.65 | End-Nov 2026 | Open | MR-2026-07 |
| P-02 | The FAO Food Price Index reaches 135 or higher | 0.35 | End-Nov 2026 | Hit Sep | MR-2026-07 |
| P-03 | US HY OAS widens to 4.00% or more at a month-end | 0.20 | End-Nov 2026 | Open | MR-2026-07 |
| P-04 | FCO rises to 30 or higher (judged on v2.1 from September 2026) | 0.15 | End-Nov 2026 | Open | MR-2026-07 |
| P-05 | At least five countries introduce or expand food or fuel subsidies | 0.75 | End-Feb 2027 | Open | MR-2026-07 |
| P-06 | Germany, France, Italy, Spain or the UK announces an emergency climate-related fiscal measure of at least 0.2% of GDP | 0.55 | End-Dec 2026 | Open | MR-2026-07 |
| P-07 | At least five countries newly introduce food export restrictions (IFPRI) | 0.40 | End-Feb 2027 | Open | MR-2026-07 |
| P-08 | GRCS4 exceeds 85 | 0.45 | End-Dec 2026 | Hit Aug | MR-2026-07 |
| P-09 | A currency crisis (over 20% fall against the dollar in three months) occurs in at least two emerging economies | 0.40 | End-Jul 2027 | Open | MR-2026-07 |
| P-10 | European natural gas exceeds a monthly average of $20/MMBtu (World Bank) | 0.45 | End-Dec 2026 | Hit Aug | MR-2026-07 |
| P-11 | The FAO Food Price Index reaches 136.0 or higher | 0.45 | End-Jan 2027 | Hit Sep | MR-2026-08 |
| P-12 | US HY OAS widens to 3.50% or more at a month-end | 0.30 | End-Feb 2027 | Open. End-Sep 3.12% | MR-2026-08 |
| P-13 | Tanker transits through the Strait of Hormuz recover to a monthly average of 20 per day or more | 0.25 | End-Feb 2027 | Open. About 13 per day | MR-2026-08 |
| P-14 | At least four countries have SURI ≥ 75 for three months in a row | 0.50 | End-Dec 2026 | Open. Month 2 | MR-2026-08 |
| P-15 | European natural gas exceeds a monthly average of $25.0/MMBtu (World Bank) | 0.40 | End-Feb 2027 | Hit Sep | MR-2026-08 |
| P-16 | SOFR−IORB reaches +10bp or more at a month-end, or the monthly peak in Fed lending reaches $50 billion or more | 0.15 | End-Mar 2027 | Open | MR-2026-09 |
| P-17 | A weekly reading of the Chicago Fed NFCI rises above 0 | 0.08 | End-Mar 2027 | Open | MR-2026-09 |
| P-18 | A weekly reading of STLFSI4 rises above 0 | 0.40 | End-Mar 2027 | Open | MR-2026-09 |
| P-19 | The FAO Food Price Index reaches 140.0 or higher | 0.35 | End-Feb 2027 | Open | MR-2026-09 |
| P-20 | At least 13 countries have SURI ≥ 60 | 0.40 | End-Dec 2026 | Open | MR-2026-09 |
5 predictions have been judged, and all were hits. The average Brier score is 0.338, worse than the coin-flip value of 0.25. A hit still scores badly when the stated probability was low. Misses are not counted until their deadlines arrive, so the hit rate at this point looks better than the true skill.
What to watch next month
In September only condition ③ of the five was met. FCO has risen for one month and is far below 30. Chain 1 is at 4.4, approaching 4.5.
| Condition | This month | Status |
|---|---|---|
| ① FFI stays above 75 | 71.45 | Not met |
| ② FCO rises two months in a row and exceeds 30 | 5.34 (up 1 month(s) in a row) | Not met |
| ③ GRCS4 exceeds 85 | 89.28 | Met |
| ④ SURI ≥ 60 exceeds 12 countries | 12 | Not met |
| ⑤ Chain 1 reaches 4.5 | 4.4 | Not met |
If two or more are met at once, we consider a regime change.
From September we also monitor the rate channel through three series: SOFR−IORB, NFCI overall and Fed lending. FDIC third-quarter data, due in late November, will show unrealized losses on bank bond holdings.
Data revision record
- The FAO Food Price Index for August 2026 was revised from 133.3 to 134.0, and the Cereal Index from 116.3 to 116.8.
- proxy-GRCS was recalculated with one IMF source across the full period. September moved from 76.3 to 74.1 and August from 63.9 to 65.1.
- September GPR was a preliminary 146.2 when prepared, later revised to 155.9. Judgmental scores were not changed.
- A rule to prevent L from ratcheting up applies from September 2026. L moves only when there is a step of +0.5 or more. This month only ② moved, from 3.9 to 4.4.
- The proposal to use FFI × GRCS4 as a warning indicator was withdrawn after the full-sample test. It remains only as a descriptive statistic.
Sources and limits
Limits of this report
- M and L are expert judgment. The anchor table narrows the range, but subjectivity remains.
- September proxy-GRCS is a nowcast and GPR gets revised. The temperature anomaly is the preliminary Climate Pulse value.
- Hormuz transits are estimates from press reports. The EM spread and the dollar index are proxy series.
- This cannot be used to predict financial crises. The full-sample test found no relationship between the objective version of this model and future financial stress.
- We cannot claim predictive skill until the Brier score stays below 0.25.
- Copernicus C3S (global temperature anomaly)
- FAO (Food Price Index)
- World Bank Pink Sheet (grains, fertilizer, Brent, European gas)
- UNCTAD and press reports (Hormuz transit estimates)
- FRED: 30-year Treasury yield, DGS30
- FRED: 10-year term premium, THREEFYTP10
- FRED: EM spread proxy, BAMLEMHBHYCRPIOAS
- FRED: dollar index proxy, DTWEXBGS
- FRED: US HY OAS, BAMLH0A0HYM2
- FRED: VIX, VIXCLS
- FRED: SOFR (spread to IORB calculated)
- FRED: bank lending standards, DRTSCILM
- FRED: STLFSI4
- FRED: Chicago Fed NFCI and subindexes
- FRED: Fed lending, WLCFLL
- Challenger, Gray & Christmas (job cuts by reason)
- ACLED (protest and battle events, for confirmation)
- IPC (acute food insecurity, for confirmation)
- Caldara & Iacoviello (GPR, Geopolitical Risk Index)
- IMF (PFOODINDEXM, POILBREUSDM)