Macro Risk Monitor: July 2026 Final (MR-2026-07)
How to read this. This report uses data as of August 17, 2026. FCO is shown under the current v2.1; it was 5.27 under v2.0 when prepared.
Interpretations in the original draft such as "room for a fall remains" and "conditions are worse than in 2007" were withdrawn after the later full-sample test and are not shown.
Conclusions of this report
- The model was fully revised to v2.0. Direction was separated from the score, fiscal risk was limited to the public sector, and a new fragility index, FFI, made three axes. SURI now covers 20 countries individually, and retrospective checks, an anchor table and a prediction log were added.
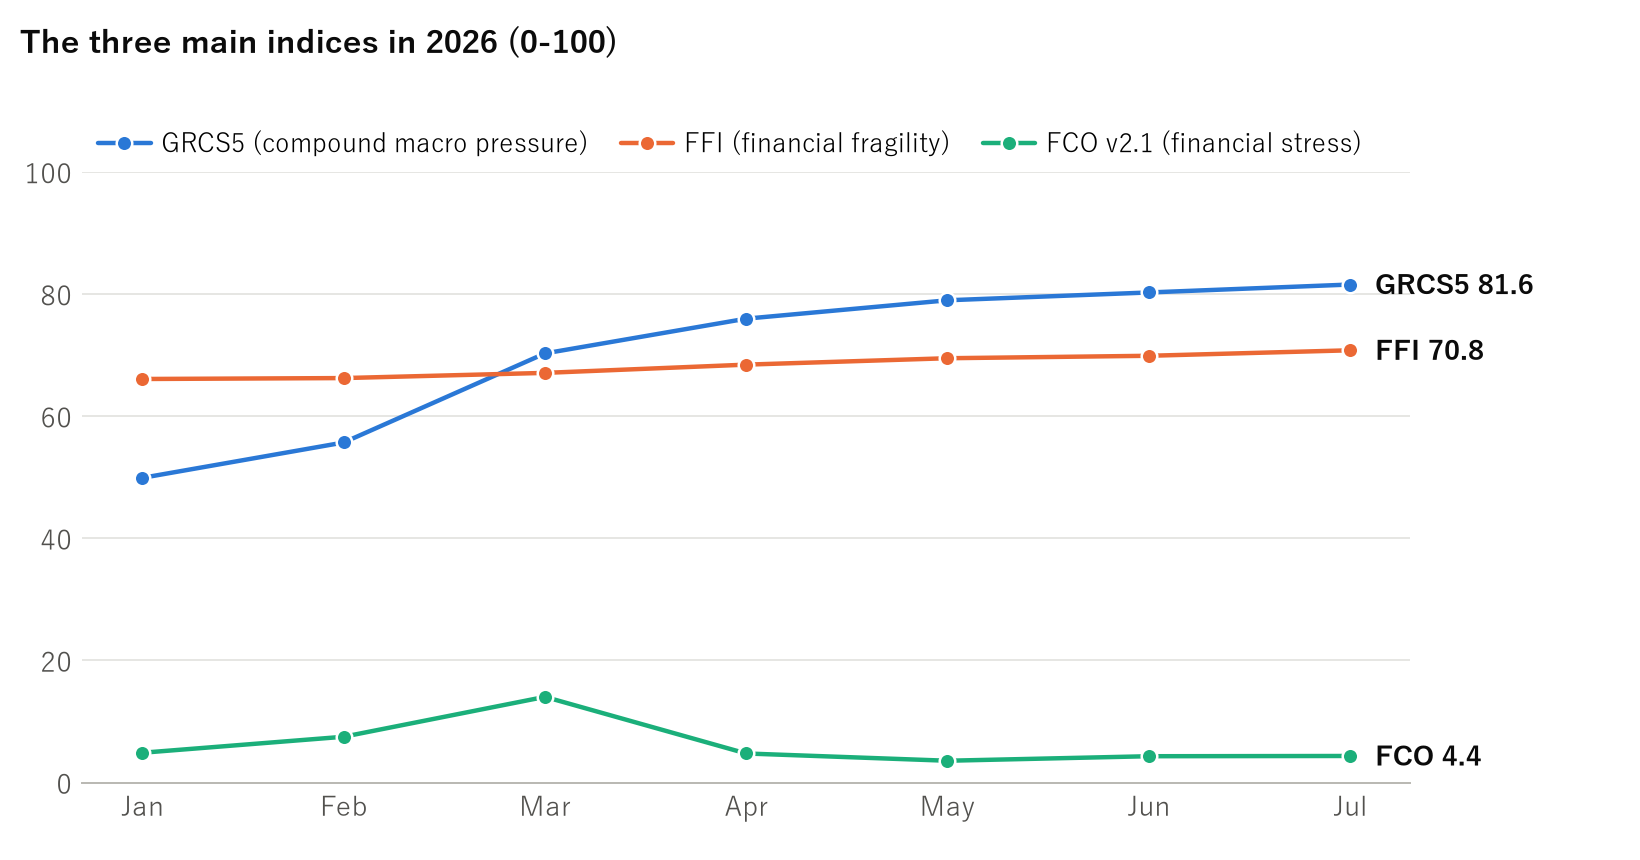
- GRCS5 rose from 49.9 in January to 81.6. The largest rise was +14.6 in March, when a geopolitical shock connected to energy, shipping, fertilizer and inflation.
- GRCS rose even as oil fell. Brent fell from $120.4 in April to $83.4 in July. The first shock appears to have moved into food, natural gas, long rates, households and social unrest.
- Financial stress is low and fragility is high. FCO is 4.36 (Low) and FFI is 70.80 (High). In June 2007 HY OAS was about 2.4%, VIX about 16 and FCO a low 5.7, yet FFI was 80. FFI was added because FCO alone misses this.
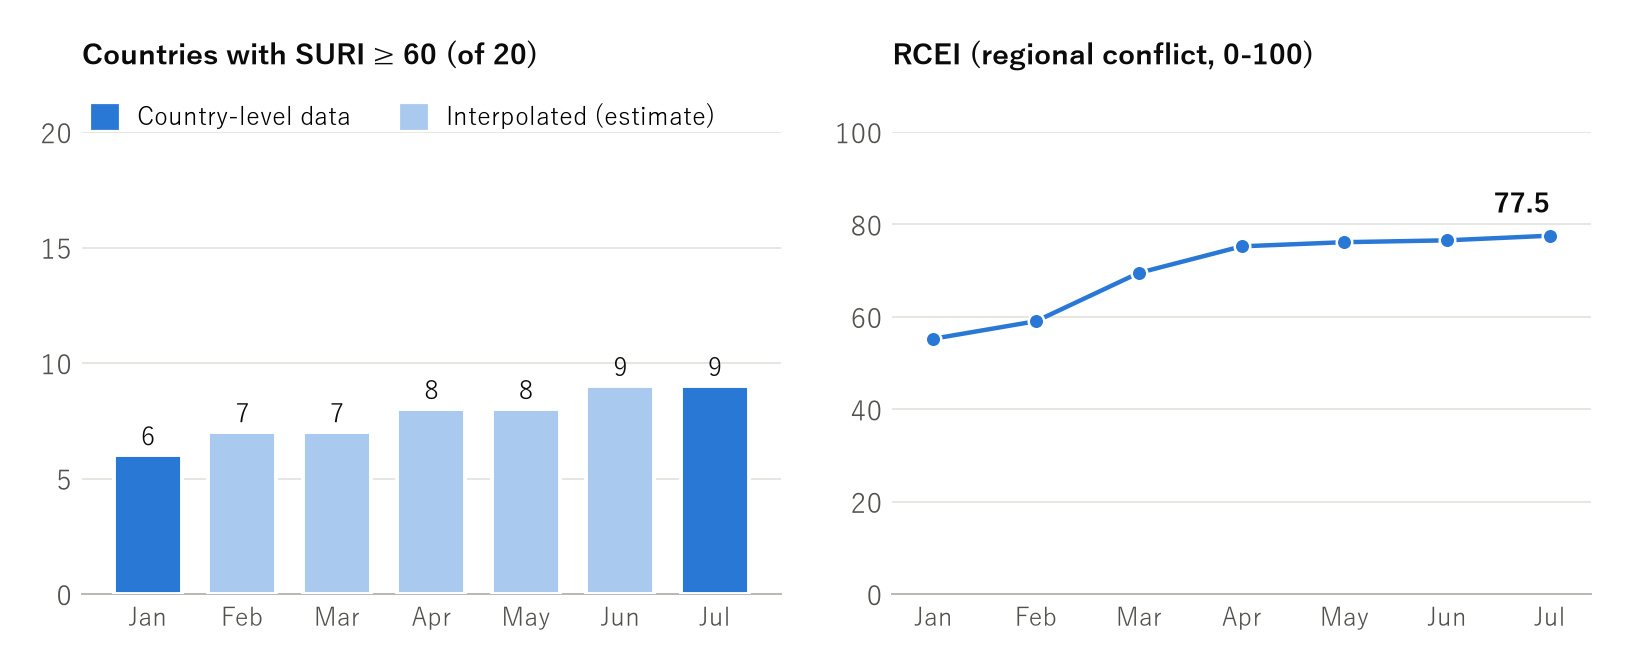
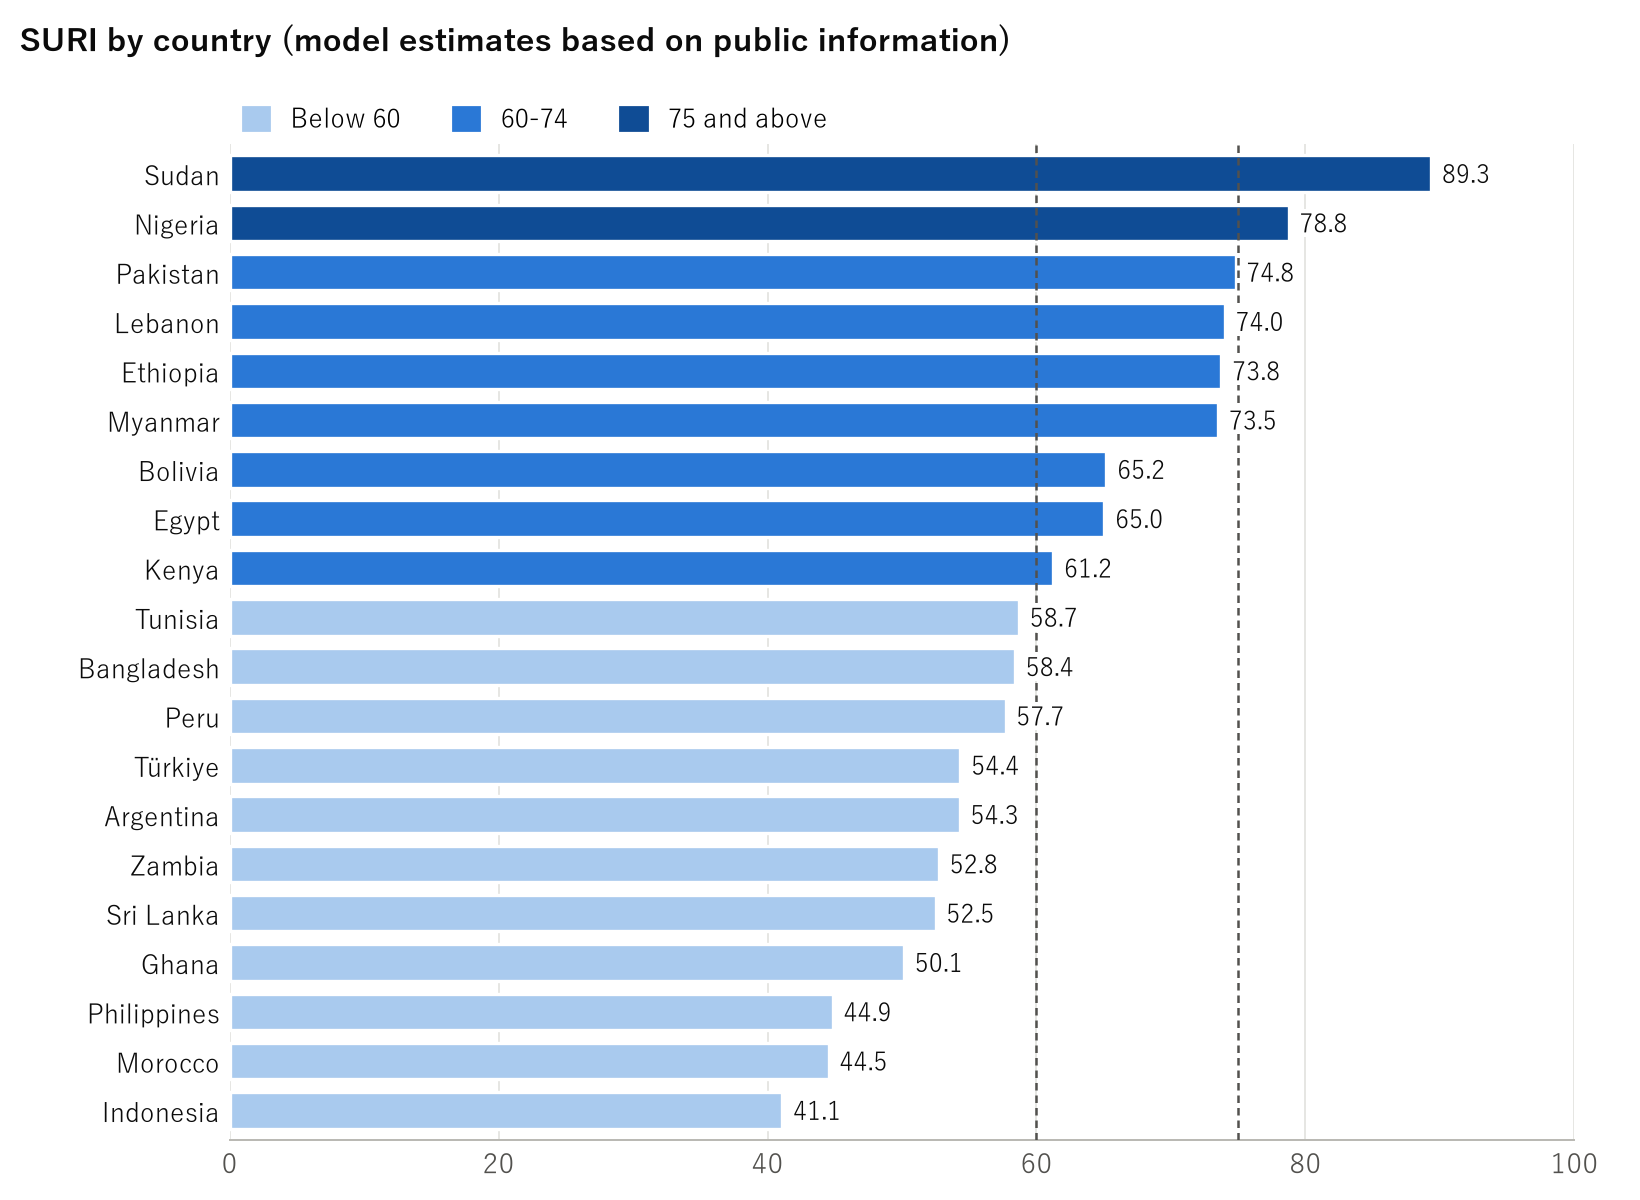
- Social unrest spread. Countries with SURI ≥ 60 rose from 6 in January to 9, and those at 75 or more from 1 to 2: Sudan at 89.35 and Nigeria at 78.75. The population-weighted figure exceeds the GDP-weighted one.
Contents
Where we stand
| Index | What it measures | This month | Prior month | Change | Band |
|---|---|---|---|---|---|
| GRCS5 | Compound macro pressure (five risks) | 81.57 | 80.27 | +1.30 | Severe |
| GRCS4 | For comparison across eras (excludes ⑤ AI) | 84.31 | 83.23 | +1.08 | Severe |
| FFI | Financial fragility (weakness built up in calm times) | 70.80 | 69.90 | +0.90 | High |
| FCO | Financial stress (tension occurring now) | 4.36 | 4.32 | +0.04 | Low |
| SCI | Strength of the chains | 77.20 | 74.00 | +3.20 | — |
| SURI≥60 | Countries with social unrest risk of 60 or more (of 20) | 9 | 9 | 0 | — |
| RCEI | Regional conflict escalation | 77.55 | 76.55 | +1.00 | Severe |
Bands are thresholds set for each index. See The Risk Measurement Model for definitions.
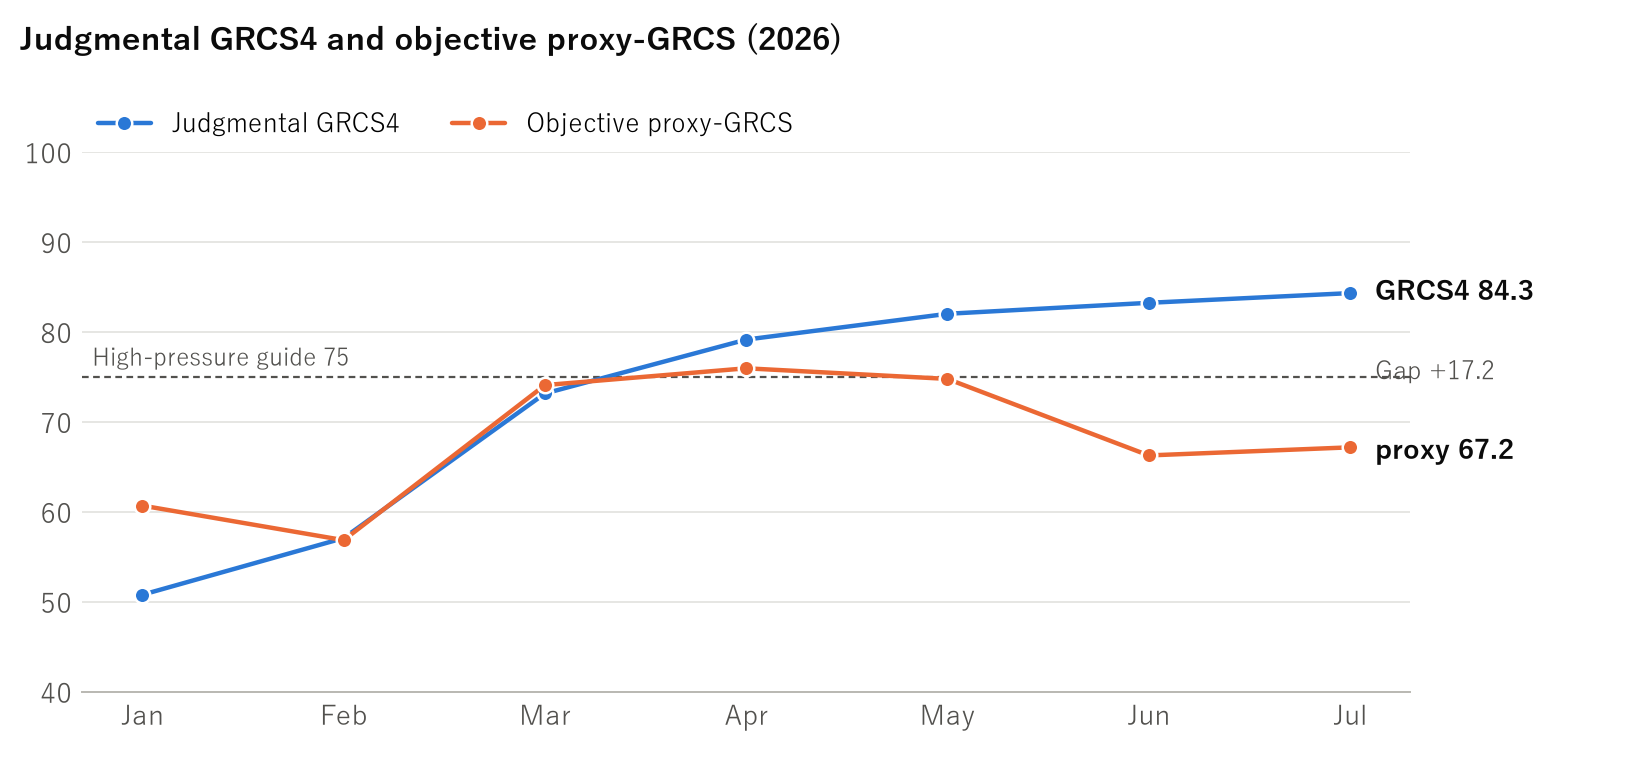
GRCS4 is 84.31, slightly above the 83.85 of March 2022. This compares two judgmental retrospective scores. On the objective proxy-GRCS, July is far below March 2022 (84.9).
Regime reading
The regime for July is Compound Macro Stress / Latent Fragility. This reading has held since April, 4 months in a row.
| Month | GRCS5 | FFI | FCO | Regime |
|---|---|---|---|---|
| Jan | 49.91 | 66.10 | 4.89 | Normal |
| Feb | 55.70 | 66.25 | 7.51 | Elevated Macro Stress |
| Mar | 70.29 | 67.10 | 14.04 | Elevated Macro Stress |
| Apr | 75.98 | 68.45 | 4.77 | Compound Macro Stress / Latent Fragility |
| May | 78.99 | 69.50 | 3.58 | Compound Macro Stress / Latent Fragility |
| Jun | 80.27 | 69.90 | 4.32 | Compound Macro Stress / Latent Fragility |
| Jul | 81.57 | 70.80 | 4.36 | Compound Macro Stress / Latent Fragility |
The five major risks
| Risk | M | L | Level | Change | D |
|---|---|---|---|---|---|
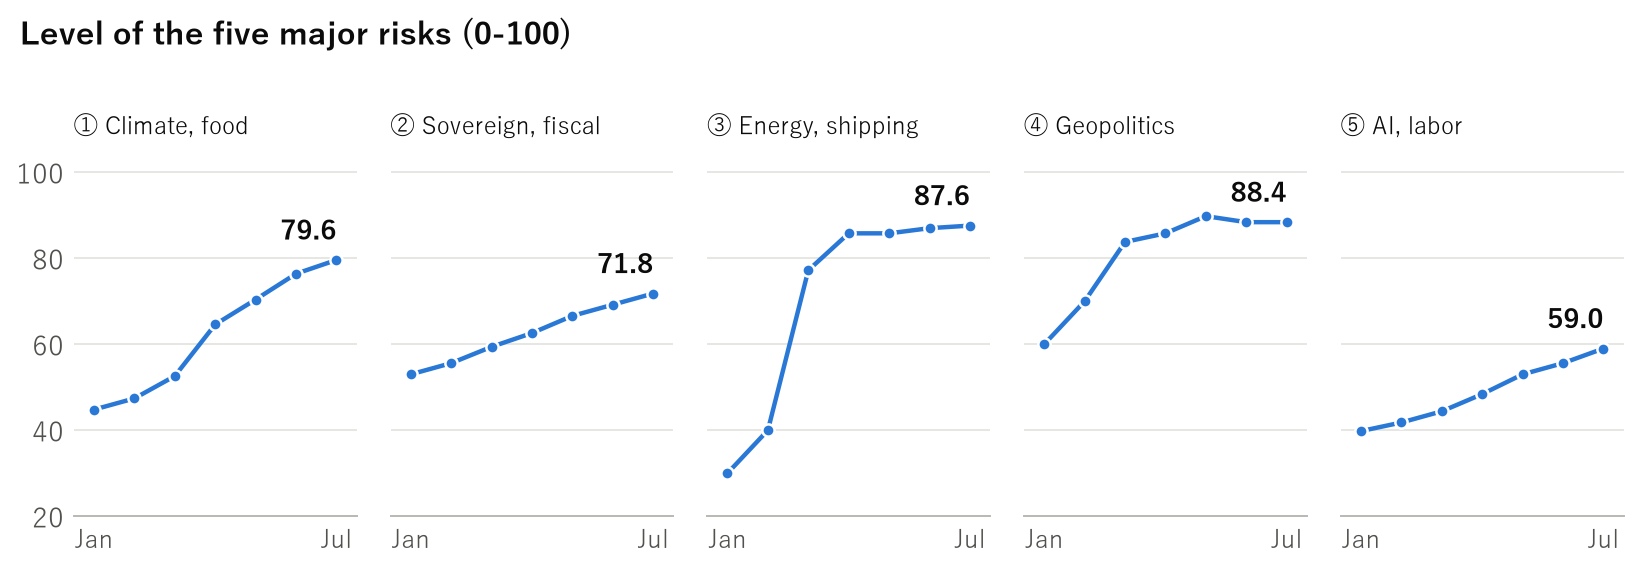
| ① Climate, food, water | 3.8 | 4.4 | 79.6 | +3.2 | +1 |
| ② Sovereign, fiscal | 3.5 | 3.8 | 71.8 | +2.6 | +1 |
| ③ Energy, shipping | 4.2 | 4.8 | 87.6 | +0.6 | 0 |
| ④ Politics, geopolitics | 4.3 | 4.7 | 88.4 | 0.0 | 0 |
| ⑤ AI, labor | 3.1 | 2.6 | 59.0 | +3.4 | +1 |
M is the level this month and L is the degree of linkage (each 1-5). Level = (0.7M + 0.3L) × 20. D is direction (−2 to +2) and is not part of the score.
Why the scores moved
- ① Climate, food, water: The temperature anomaly rose from 0.56°C to 0.67°C and FAO from 130.4 to 131.1. We raised M from 3.7 to 3.8 and L from 4.1 to 4.4.
- ② Sovereign, fiscal: The 30-year Treasury rose from 4.95% to 5.10% and the term premium from 0.70% to 0.87%. We raised M from 3.4 to 3.5 and L from 3.6 to 3.8.
- ③ Energy, shipping: Brent fell slightly to $83.4, but European gas rose to $18.06 and transits fell from about 35 to about 15 per day. M stays at 4.2 and L rose from 4.7 to 4.8.
- ④ Politics, geopolitics: M stays at 4.3 and L at 4.7. The regional war continues.
- ⑤ AI, labor: The share of job cuts attributed to AI moved from 31% to 33%. We raised M from 2.9 to 3.1 and L from 2.5 to 2.6.
An apparent fall in energy was corrected. Under the old formula ③ appeared to fall from 96 in April to 88 in July. That was because direction D moved from +2 to 0, while M stayed at 4.2 and L rose from 4.5 to 4.8. Under the new formula it rises from 85.8 to 87.6. Separating D removes the problem of an index falling merely because deterioration has paused.
Main real-economy indicators
| Indicator | Prior month | This month |
|---|---|---|
| Global temperature anomaly (°C) | 0.56 | 0.67 |
| FAO Food Price Index | 130.4 | 131.1 |
| FAO Cereal Price Index | — | 113.8 |
| Brent crude ($) | 85.4 | 83.4 |
| European gas ($/MMBtu) | 15.17 | 18.06 |
| Hormuz transits (per day, press estimates) | 35 | 15 |
| Share of job cuts attributed to AI (%) | 31 | 33 |
Brent and European gas are World Bank monthly averages. FAO values are as published when each report was prepared; later revisions are in the revision record.
Three-layer check of financial contagion
No layer shows contagion. In the price layer, HY OAS is 2.85% and VIX 15.99. In the credit and leverage layer, NFCI overall is −0.53 and net tightening of bank lending standards fell to 0.0%. In the plumbing layer, SOFR−IORB is +1bp.
| Layer | Indicator | Prior month | This month |
|---|---|---|---|
| Price layer | US HY OAS (%, month-end) | 2.75 | 2.85 |
| Price layer | EM spread proxy (bp) | 311 | 299 |
| Price layer | VIX (month-end) | 16.45 | 15.99 |
| Price layer | STLFSI4 | −0.80 | −0.73 |
| Price layer | 30-year Treasury (%, monthly average) | 4.95 | 5.10 |
| Price layer | 10-year term premium (%) | 0.70 | 0.87 |
| Price layer | Dollar index proxy | 120.92 | 119.70 |
| Credit and leverage layer | NFCI overall | −0.51 | −0.53 |
| Credit and leverage layer | NFCI credit | −0.03 | −0.04 |
| Credit and leverage layer | NFCI leverage | 0.25 | 0.16 |
| Credit and leverage layer | NFCI nonfinancial leverage | −0.54 | −0.52 |
| Credit and leverage layer | Bank lending standards (net tightening %) | 8.1 (April survey) | 0.0 (July survey) |
| Plumbing layer | SOFR−IORB (bp) | +3 | +1 |
| Plumbing layer | Monthly peak in Fed lending ($ billion) | 8.0 | 7.8 |
STLFSI4 and the NFCI series have an average of 0; negative readings are looser than average. The EM spread and the dollar index are proxy series.
Breakdown of FCO v2.1
| Component | Weight | Source value | Score |
|---|---|---|---|
| Credit (HY OAS) | 0.25 | 2.85% | 4.80 |
| Volatility (VIX) | 0.20 | 15.99 | 8.32 |
| Funding (SOFR−IORB) | 0.15 | +1 bp | 5.00 |
| Banks (lending standards) | 0.15 | Expert judgment | 5.00 |
| Liquidity | 0.10 | Expert judgment | 0.00 |
| Intervention use (Fed lending) | 0.15 | 7.8 | 0.00 |
| FCO | 1.00 | — | 4.36 |
FCO is calculated under the current v2.1. It was 5.27 under v2.0 when prepared. Both are in the Low band.
Breakdown of FFI
| Component | Weight | Prior month | This month |
|---|---|---|---|
| Leverage and credit quality | 0.20 | 72 | 73 |
| Maturity wall | 0.15 | 65 | 66 |
| Valuation and spread compression | 0.20 | 76 | 77 |
| Opaque assets | 0.20 | 72 | 73 |
| Bank lending standards and balance sheets | 0.10 | 58 | 58 |
| External vulnerability (EM) | 0.15 | 69 | 70 |
| FFI | 1.00 | 69.90 | 70.80 |
FFI rose from 69.9 to 70.8 and is High at this point. Valuation moved from 76 to 77.
Social unrest and regional conflict
SURI was rebuilt country by country for 20 countries because an average flattens the distribution. Country data exist for January and July, and February to June are interpolated. The change column shows the change since January.
Countries with SURI ≥ 60 rose from 6 in January to 9. The simple average is 61.25, population-weighted 61.88 and GDP-weighted 55.21. RCEI is 77.55.
| Country | Household | Protest | Government | Conflict | SURI | Since Jan | Main factors |
|---|---|---|---|---|---|---|---|
| Sudan | 95 | 70 | 95 | 98 | 89.35 | +6.15 | Civil war and famine risk; conflict is the main cause of the food crisis |
| Nigeria | 85 | 72 | 70 | 85 | 78.75 | +11.40 | Fuel subsidy cuts, a weak currency and elections; a priority country for monitoring |
| Pakistan | 78 | 70 | 72 | 78 | 74.80 | +11.45 | Food, electricity and external debt; a large population |
| Lebanon | 80 | 60 | 85 | 70 | 74.00 | +7.40 | Currency and public finances have already broken down |
| Ethiopia | 80 | 55 | 75 | 85 | 73.75 | +8.00 | Conflict and drought combined |
| Myanmar | 75 | 45 | 85 | 95 | 73.50 | +5.40 | Continuing civil war; armed conflict is the main channel rather than protest |
| Bolivia | 72 | 80 | 70 | 30 | 65.20 | +12.50 | Protests against fuel subsidy cuts have spread nationwide |
| Egypt | 82 | 55 | 68 | 45 | 65.05 | +9.75 | Bread and fuel subsidies act as a political stabilizer tied directly to public finances |
| Kenya | 70 | 75 | 55 | 35 | 61.25 | +11.95 | Fuel price protests with fatalities; protest mobilization stands out |
| Tunisia | 72 | 58 | 65 | 30 | 58.70 | +8.15 | Food import dependence and fragile public finances |
| Bangladesh | 68 | 60 | 58 | 40 | 58.40 | +9.45 | Food and energy imports; unstable politics |
| Peru | 62 | 72 | 60 | 30 | 57.70 | +10.80 | Calmed for now by a fuel subsidy, but public finances have worsened |
| Türkiye | 70 | 45 | 48 | 45 | 54.35 | +6.15 | Chronic high inflation |
| Argentina | 68 | 62 | 55 | 20 | 54.30 | +4.85 | Austerity and falling real incomes |
| Zambia | 70 | 45 | 60 | 25 | 52.75 | +7.60 | Debt restructuring in progress and drought |
| Sri Lanka | 65 | 55 | 55 | 25 | 52.50 | +6.15 | Risk of a repeat of the 2022 crisis |
| Ghana | 65 | 48 | 52 | 25 | 50.15 | +7.05 | Cost-of-living pressure after debt restructuring |
| Philippines | 55 | 40 | 38 | 40 | 44.85 | +5.80 | Rice prices have become a political issue |
| Morocco | 58 | 45 | 40 | 25 | 44.55 | +6.30 | Lower farm output due to drought |
| Indonesia | 52 | 42 | 32 | 30 | 41.10 | +5.75 | Growing fiscal burden of subsidies |
SURI by country is a set of model estimates based on public information. It is not an official assessment or rating of any country. SURI = 0.35 Household Stress + 0.25 Protest Mobilization + 0.20 Government Fragility + 0.20 Conflict Transmission.
| Month | SURI ≥ 60 | SURI ≥ 75 | Simple average | Population-weighted | GDP-weighted | Maximum | Data |
|---|---|---|---|---|---|---|---|
| Jan | 6 | 1 | 53.15 | 53.38 | 47.80 | 83.20 | Country-level data |
| Jun | 9 | 2 | 59.90 | 60.46 | 53.97 | 88.32 | Interpolated (estimate) |
| Jul | 9 | 2 | 61.25 | 61.88 | 55.21 | 89.35 | Country-level data |
| Component | Prior month | This month |
|---|---|---|
| Combat intensity | 85 | 85 |
| Escalation speed | 74 | 75 |
| State fragility | 64 | 65 |
| Food, energy, water | 73 | 75 |
| Refugees, cross-border | 80 | 82 |
| RCEI | 76.55 | 77.55 |
Strength of the chains
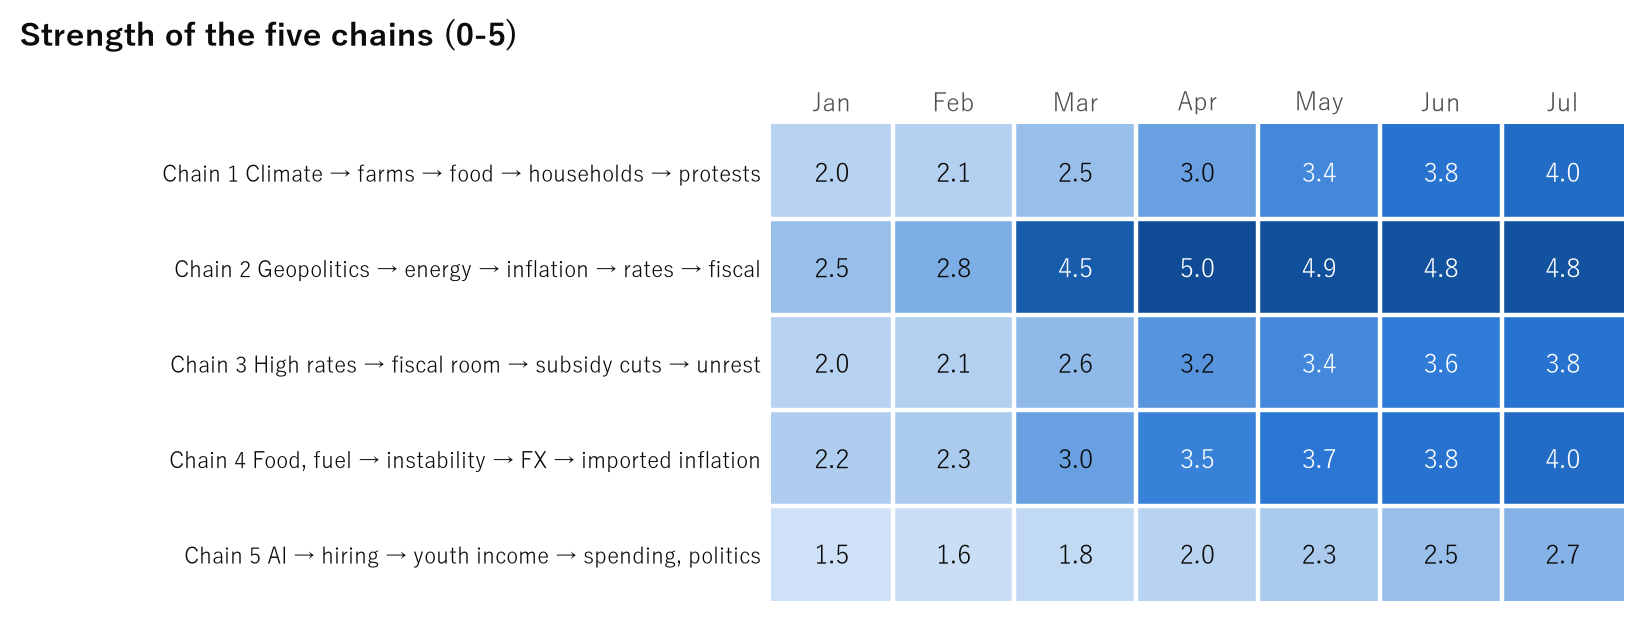
SCI rose from 74.0 to 77.2. Chain 1 rose from 3.8 to 4.0, Chain 4 from 3.8 to 4.0 and Chain 3 from 3.6 to 3.8.
| Chain | Prior month | This month | Change |
|---|---|---|---|
| Chain 1 Climate → farms → food → households → protests | 3.8 | 4.0 | +0.2 |
| Chain 2 Geopolitics → energy → inflation → rates → fiscal | 4.8 | 4.8 | 0.0 |
| Chain 3 High rates → fiscal room → subsidy cuts → unrest | 3.6 | 3.8 | +0.2 |
| Chain 4 Food, fuel → instability → FX → imported inflation | 3.8 | 4.0 | +0.2 |
| Chain 5 AI → hiring → youth income → spending, politics | 2.5 | 2.7 | +0.2 |
| SCI (average of chains × 20) | 74.0 | 77.2 | +3.2 |
Judgmental and objective compared
Judgmental GRCS4 is 84.31 and objective proxy-GRCS is 67.2 (57.5th percentile), a gap of +17.1.
| Month | GRCS4 (judgmental) | proxy-GRCS (objective) | Historical percentile | Gap |
|---|---|---|---|---|
| Jan | 50.77 | 60.7 | 42.5 | −9.9 |
| Feb | 57.07 | 56.8 | 34.1 | +0.2 |
| Mar | 73.15 | 74.1 | 81.6 | −0.9 |
| Apr | 79.14 | 76.0 | 88.0 | +3.2 |
| May | 82.01 | 74.8 | 84.4 | +7.2 |
| Jun | 83.23 | 66.3 | 55.6 | +17.0 |
| Jul | 84.31 | 67.2 | 57.5 | +17.2 |
proxy-GRCS did not yet exist when this report was prepared. The values shown were calculated later with the method unified in October 2026.
Prediction log
The prediction log starts with this issue. Each prediction is written so anyone can judge it, with a probability and a deadline. This issue added P-01 to P-10.
| ID | Prediction | Probability | Deadline | Status | Issued |
|---|---|---|---|---|---|
| P-01 | Protests over the cost of living or fuel with fatalities occur in at least three countries with SURI ≥ 60 | 0.65 | End-Nov 2026 | Open | MR-2026-07 |
| P-02 | The FAO Food Price Index reaches 135 or higher | 0.35 | End-Nov 2026 | Open | MR-2026-07 |
| P-03 | US HY OAS widens to 4.00% or more at a month-end | 0.20 | End-Nov 2026 | Open | MR-2026-07 |
| P-04 | FCO rises to 30 or higher (judged on v2.1 from September 2026) | 0.15 | End-Nov 2026 | Open | MR-2026-07 |
| P-05 | At least five countries introduce or expand food or fuel subsidies | 0.75 | End-Feb 2027 | Open | MR-2026-07 |
| P-06 | Germany, France, Italy, Spain or the UK announces an emergency climate-related fiscal measure of at least 0.2% of GDP | 0.55 | End-Dec 2026 | Open | MR-2026-07 |
| P-07 | At least five countries newly introduce food export restrictions (IFPRI) | 0.40 | End-Feb 2027 | Open | MR-2026-07 |
| P-08 | GRCS4 exceeds 85 | 0.45 | End-Dec 2026 | Open | MR-2026-07 |
| P-09 | A currency crisis (over 20% fall against the dollar in three months) occurs in at least two emerging economies | 0.40 | End-Jul 2027 | Open | MR-2026-07 |
| P-10 | European natural gas exceeds a monthly average of $20/MMBtu (World Bank) | 0.45 | End-Dec 2026 | Open | MR-2026-07 |
No prediction had been judged at the time of this report.
What to watch next month
This issue set the following five conditions. None was met in July.
| Condition | This month | Status |
|---|---|---|
| ① FFI stays above 75 | 70.80 | Not met |
| ② FCO rises two months in a row and exceeds 30 | 4.36 (up 2 month(s) in a row) | Not met |
| ③ GRCS4 exceeds 85 | 84.31 | Not met |
| ④ SURI ≥ 60 exceeds 12 countries | 9 | Not met |
| ⑤ Chain 1 reaches 4.5 | 4.0 | Not met |
If two or more are met at once, we consider a regime change.
Data revision record
- The FAO Food Price Index for April 2026 was revised from 131.1 to 130.7.
- The AI share of job cuts was split into monthly and year-to-date figures.
- FCO was recalculated under the current v2.1. It was 5.27 under v2.0 when prepared.
Sources and limits
Limits of this report
- Country SURI values for February to June are interpolated.
- M and L are expert judgment. Retrospective scores are not official indexes of the time.
- Hormuz transits are estimates from press reports.
- Copernicus C3S (global temperature anomaly)
- FAO (Food Price Index)
- World Bank Pink Sheet (grains, fertilizer, Brent, European gas)
- UNCTAD and press reports (Hormuz transit estimates)
- FRED: 30-year Treasury yield, DGS30
- FRED: 10-year term premium, THREEFYTP10
- FRED: EM spread proxy, BAMLEMHBHYCRPIOAS
- FRED: dollar index proxy, DTWEXBGS
- FRED: US HY OAS, BAMLH0A0HYM2
- FRED: VIX, VIXCLS
- FRED: SOFR (spread to IORB calculated)
- FRED: bank lending standards, DRTSCILM
- FRED: STLFSI4
- FRED: Chicago Fed NFCI and subindexes
- FRED: Fed lending, WLCFLL
- Challenger, Gray & Christmas (job cuts by reason)
- ACLED (protest and battle events, for confirmation)
- IPC (acute food insecurity, for confirmation)
- Caldara & Iacoviello (GPR, Geopolitical Risk Index)
- IMF (PFOODINDEXM, POILBREUSDM)