The AI Ecosystem at a Glance · 2/4
AI Ecosystem Cash Flow Model: Can AI Circular Financing Pay Back?
If the AI businesses of the 14 companies in the circular financing map are consolidated into a single group, the ecosystem's cash flow does not currently stand on its own. Whether it can depends on whether external end-user revenue keeps growing at about 37% a year for the next nine years. In the central scenario (Base, 28% annual growth) the investment is not paid back within 10 years, and the model's answer is that it is not yet clear whether the ecosystem can become self-sustaining.
- 2026 snapshot: Cash coming in from outside the group is about $150bn of end-user AI spending plus about $120bn of gross profit on chip sales outside the group. Capex flowing out is about $450bn (excluding intra-group chip margins), leaving a cash shortfall of about $320bn a year.
- Base (28% annual growth): Annual FCF turns positive in 2033, the cumulative deficit bottoms out at about $1.5tn in 2032, and payback comes in 2038.
- Bull (in line with company business plans): Even with end-user revenue reaching about $950bn in 2030, capex rises too, so payback comes exactly in 2035.
- Bear (revenue stalls and capex is cut): No payback by 2040, and about $1tn of external debt remains.
- Who really fills the gap: Through 2035, most of the shortfall is covered by about $900bn of profits from the legacy businesses of Microsoft, Alphabet, Amazon and Oracle (search ads, Office, retail, traditional cloud) and by external borrowing that peaks at about $1.1tn (Base).
- The six investees: Only Anthropic has enough cash to reach profitability without new funding. The other five will need additional funding in 2027–28.
The IMF's "$1.4 trillion of revenue commitments" disappears on consolidation. But the cost of the facilities built on those commitments, and the debt taken on to build them, do not.
The figures on this page are model estimates based on our own estimates and assumptions from public information. They do not forecast or guarantee future results or market developments. Each item is labeled as "fact," "estimate" or "assumption" in the tables. Unless otherwise noted, figures are in nominal US dollars on a calendar-year basis.
What disappears on consolidation, and what remains
If the 14 companies are treated as one corporate group and consolidated, two of the three flows in IMF Figure 1.2, equity and revenue commitments, cancel out and disappear, but almost all of the debt remains. That is because the lenders (banks, bond investors and private credit) sit outside the group.
| Flow in the IMF figure | Amount (IMF) | After consolidation | Why |
|---|---|---|---|
| Equity investment (blue) | ~$300bn | Disappears | Both investor and investee are inside the group. The group's cash does not increase |
| Future revenue commitments (green) | ~$1.4tn | Disappears | OpenAI's and Anthropic's payments become revenue for Oracle, Microsoft, NVIDIA and others, and cancel out within the group |
| Debt (red) | ~$650bn | Remains | The lenders are external. Investor guarantees (such as NVIDIA's lease guarantee) simply become group borrowing on consolidation |
After consolidation, only cash moving in and out of the group matters.
- Cash coming in: End-user AI spending (consumer subscriptions, enterprise use of APIs, Copilot and agents, and AI-driven ad revenue) and chip sales to buyers outside the group (Meta, governments, ordinary companies, other neoclouds).
- Cash going out: Data center construction, power equipment, memory and TSMC foundry costs; electricity and operating costs; payroll; purchases of compute from outside the group (Nscale, Lambda and others); and interest on external debt.
- An example of an intra-group transaction that disappears: NVIDIA invests in OpenAI → OpenAI pays Oracle → Oracle buys NVIDIA GPUs. On consolidation, all that remains is the manufacturing cost NVIDIA paid to TSMC and memory makers, and the construction and electricity costs Oracle paid. NVIDIA's roughly 75% gross margin becomes nothing more than intra-group pricing.
This model carves out only the AI-related parts of the 14 companies as a single "consolidated AI group." The profits of Microsoft, Amazon, Alphabet and Oracle from search ads, Office, retail and traditional cloud are treated as the "parent companies' wallet" outside the group, and we show separately how much of the AI deficit they cover.
The same dollar booked as revenue many times
In 2026 the 14 companies book a combined total of about $710bn of AI-related revenue on a standalone basis, but on consolidation only about $330bn comes from outside the group. The remaining roughly $380bn is chips and cloud bought and sold within the group.
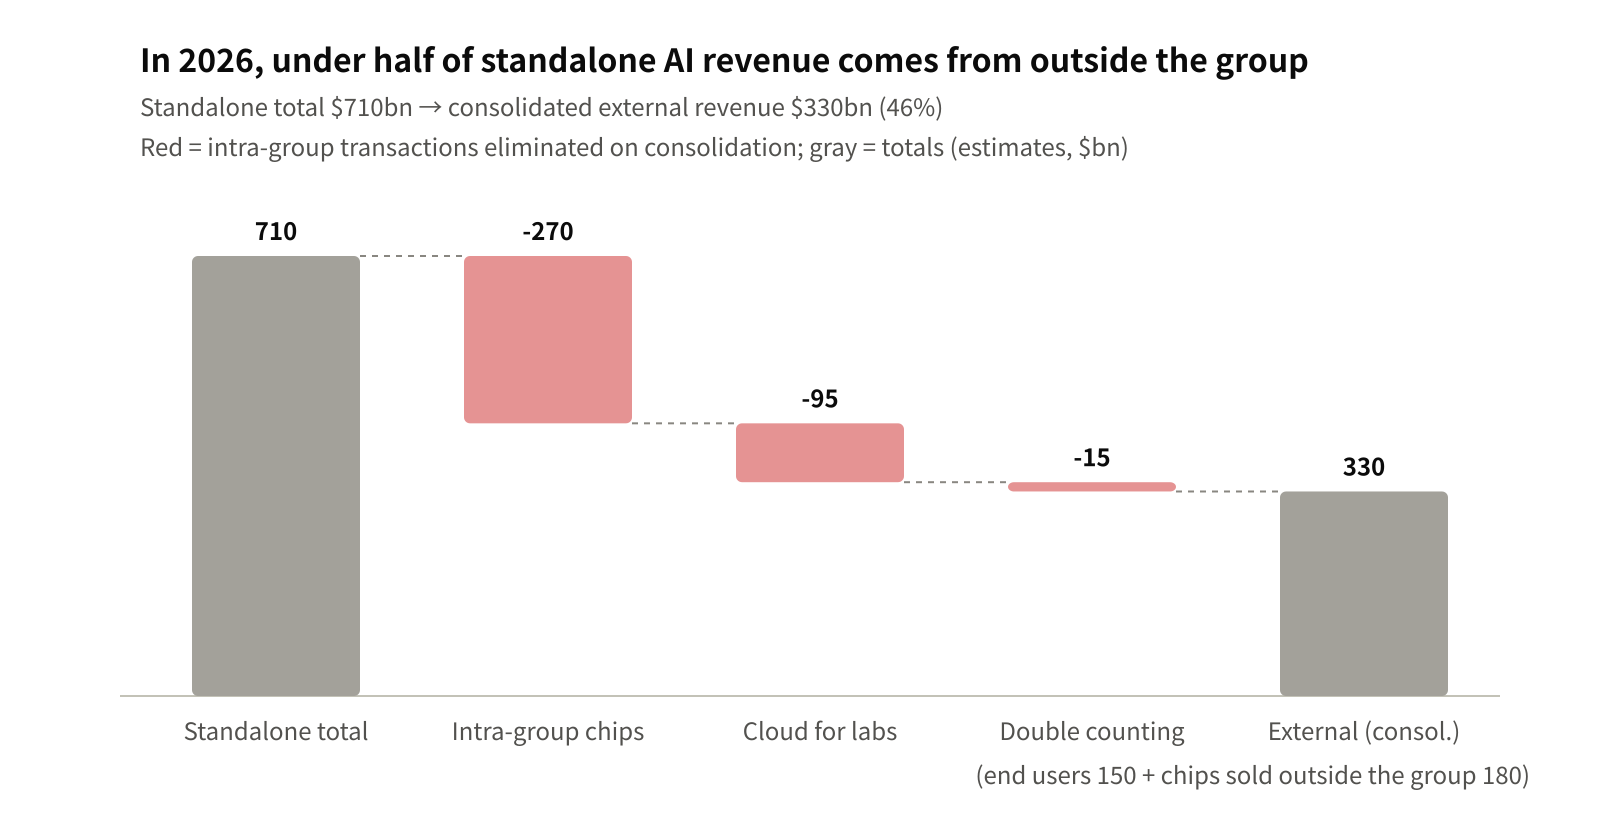
Of the $330bn of external revenue, $180bn is chip sales to Meta, governments and ordinary companies. That demand is ultimately also supported by the AI investment boom outside the group, and what final AI users actually pay is only about $150bn.
Scenario assumptions
Two things separate the scenarios: the growth rate of end-user revenue and the pace of capex. The 2026 starting point is common to all scenarios and is estimated from financial results and disclosures. Figures in billions of dollars.
| Assumption | Base | Bull | Bear | Type and basis |
|---|---|---|---|---|
| 2026 end-user AI revenue | 150 | 150 | 150 | Estimate. OpenAI 36 (company forecast), Anthropic ~50 (based on 16.3 in the first half), hyperscalers' AI revenue from external customers ~75. Double counting (e.g. via Bedrock) removed |
| Revenue growth 2027 → 2030 → 2035 | 70% → 30% → 10% | 90% → 35% → 12% | 45% → 15% → 6% | Assumption. Bull is consistent with OpenAI's own plan of $350bn by 2030 |
| 2030 end-user revenue | 696 | 952 | 390 | Calculated from the growth rates above |
| 2026 total AI capex | 670 | 670 | 670 | Estimate. AI share of Microsoft ~170, Amazon ~220 and Alphabet 195–205 (all facts), plus Oracle, CoreWeave, xAI and Stargate-related SPVs |
| Capex growth 2027 → 2030 | +25% → 0% | +35% → +8% | +15% → −10% | Assumption. Alphabet and Amazon have announced large increases for 2027 (fact). Bear cuts capex in 2028–30 |
| Chip margin eliminated | 32.5% of capex | Same | Same | Assumption. Half of capex goes to chip companies inside the group, at a 65% gross margin. NVIDIA's 75% gross margin is a fact |
| Chip sales outside the group | 180, 65% gross margin | Same, faster growth | Same, 55% gross margin, declining from 2028 | Estimate. About 40% of NVIDIA's data center revenue (Meta, governments, ordinary companies, etc.) |
| External operating costs | 30% → 25% of revenue + 4% of facilities | 30% → 20% + 4% | 35% → 32% + 4% | Assumption. Payroll, sales costs and compute bought outside the group, plus power and operating costs |
| External debt (opening) and interest rate | 650, 6.5% | Same | Same | 650 is from the IMF (fact). The rate is an assumption |
| Cash available from parents' legacy businesses | 150 a year, +3%/yr | Same | Same | Assumption. Non-AI operating cash flow less dividends and buybacks |
| Funding for any remaining gap | 65% debt, 35% equity | Same | Same | Assumption |
Formula: FCF = end-user revenue + gross profit on external chip sales − external operating costs − capex on an external-payment basis − interest on external debt. Taxes, working capital and FX are not included.
The cumulative cash flow gap
In every scenario, a cumulative cash shortfall of around $1.4tn builds up over the five years to 2030. The scenarios diverge only from 2031 onward. Until then, faster revenue growth also means more investment, so even the bullish scenario barely narrows the shortfall.
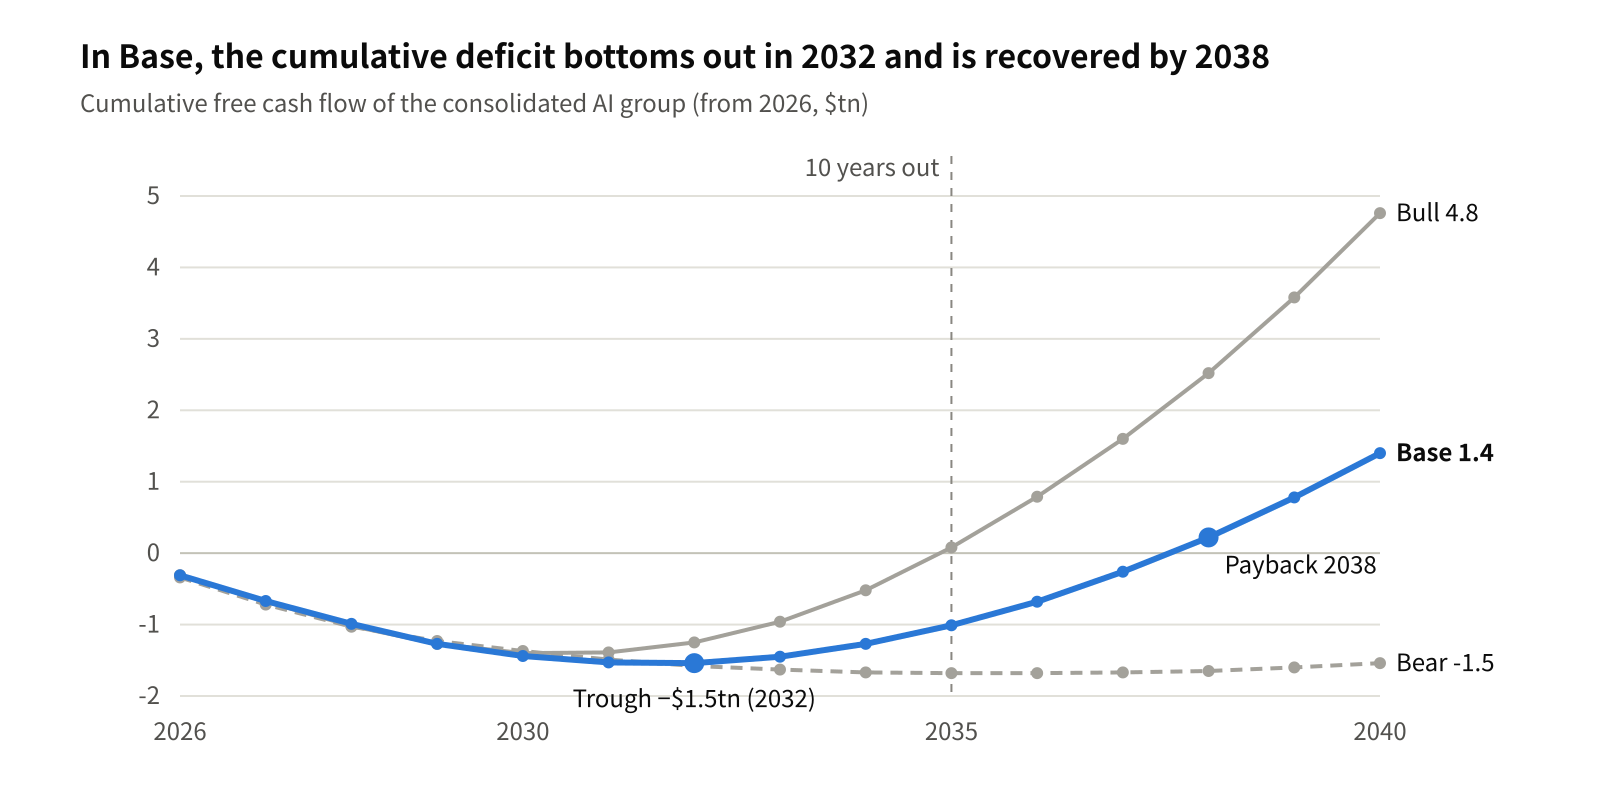
Only Bull is back in positive cumulative territory ten years out, in 2035. In Bear, cutting capex narrows the annual deficit, but the debt used to build the facilities remains and the cumulative deficit is still about $1.5tn in 2040. In that case, much of the installed capacity would face impairment.
What it takes to break even
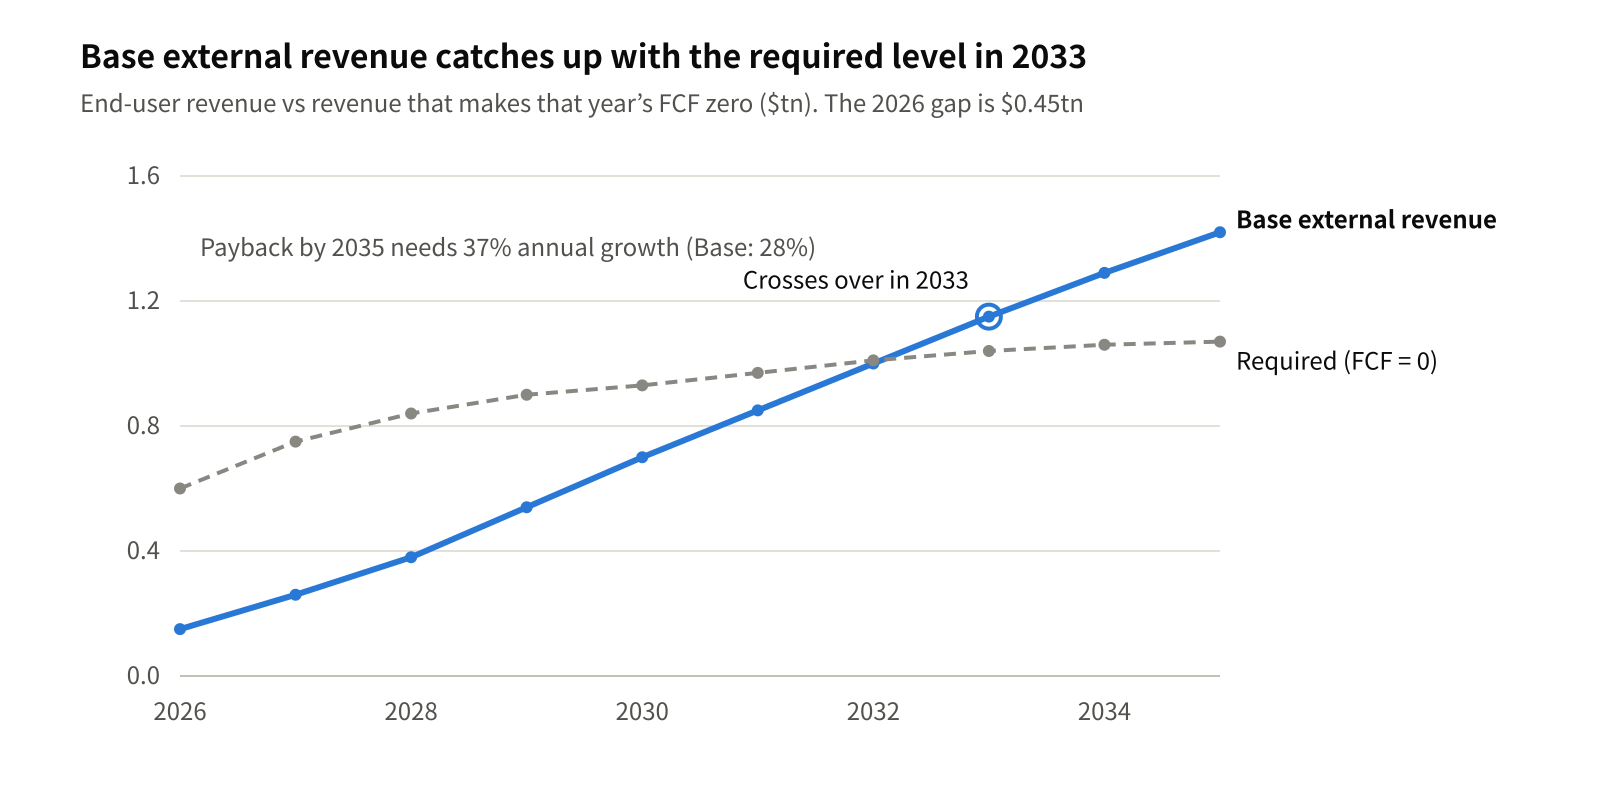
For the ecosystem to stand on its own, external end-user revenue must keep growing at 37% a year from about $150bn in 2026 to about $2.6tn in 2035 (the condition for bringing the cumulative total back to zero by 2035, given Base capex). Turning annual cash flow positive by 2030 would require 58% annual growth.
| Condition (Base capex path) | External revenue needed in 2030 | External revenue needed in 2035 |
|---|---|---|
| Zero cash flow in that year | ~$930bn | ~$1.07tn |
| Also covers depreciation and a 10% cost of capital | ~$930bn | ~$1.22tn |
For reference, Bain estimates that $2tn of new annual revenue will be needed worldwide by 2030. Our estimate is smaller because it covers only the 14 companies, but the picture is the same: external revenue must be six times today's level by 2030. OpenAI's own plan ($350bn in 2030) is about 40% of that requirement.
Who fills the shortfall
In Base, of the roughly $1.5tn shortfall through 2032, about 60% is covered by profits from the legacy businesses of Microsoft, Alphabet, Amazon and Oracle, and the rest by external debt and equity. Seen on a consolidated basis, AI cash flow is propped up by "old money" from search ads, Office and retail.
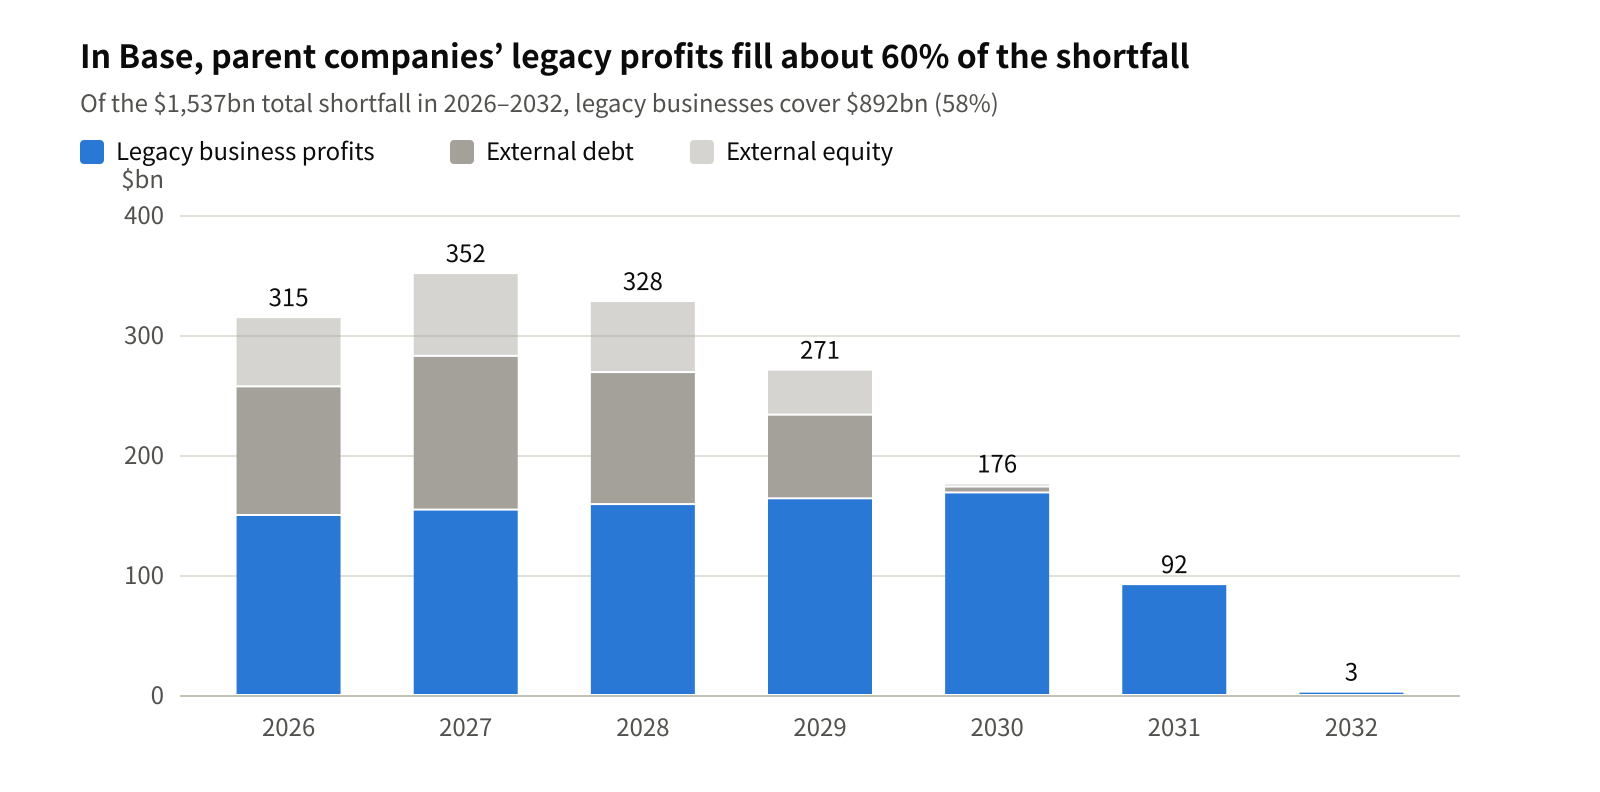
External debt grows from about $650bn at the start of 2026 (IMF) to about $1.07tn in 2030 and is fully repaid in 2037. In Bear it stays at about $1tn, and interest alone costs about $70bn a year. OpenAI, Anthropic, CoreWeave and xAI, which have no legacy businesses, and SoftBank, which borrows to invest, sit outside this cushion. Consolidation averages this away, but the burden falls disproportionately on the companies with the weakest funding.
Transparency issues
Each company's accounts may be correct on a standalone basis, but added together the same cash is counted many times as revenue or backlog, and each instance is reflected in share prices with a multiple applied. Because no company controls the others, accounting standards have no rule requiring this kind of "ecosystem consolidation."
- Revenue counted multiple times: In 2026, about 54% of the roughly $710bn of combined standalone AI revenue is intra-group (estimate). Major-customer disclosure is only required above thresholds such as 10% of revenue, and almost no company separately reports "revenue from investees."
- Swelling backlogs: Oracle's RPO of $664bn, Microsoft's $627bn, Google Cloud's $560.8bn and CoreWeave's $104bn add up to about $1.9tn. A large part consists of commitments from OpenAI and Anthropic, whose combined 2026 revenue is about $86bn. Whether the backlog is realized depends less on "customers' earning power" than on "customers' ability to keep raising money."
- Profits generated inside the loop: When NVIDIA invests in OpenAI and that money eventually comes back to buy NVIDIA products, NVIDIA books the investment as an asset and the sale as profit. On consolidation, that profit would be eliminated as unrealized profit.
- Self-reinforcing valuations: When an AI lab's valuation rises in a funding round in which its own investors take part, the existing stakes produce valuation gains. The basis for that valuation is a revenue plan that assumes payments to those same investors.
- Less visible debt: Loans to SPVs, lease guarantees (NVIDIA, up to $105bn) and residual value guarantees (Broadcom) do not appear on the parent's balance sheet, only in the notes. On consolidation, all of it is group borrowing.
The adjustment investors can make themselves is to strip out "revenue promised by investees and partners." In practice that means RPO broken down by counterparty, notes on related-party transactions and guarantees, and running totals on an external-revenue basis like this model.
Company models for the six investees
Of the six investees, only Anthropic has enough cash to reach profitability without new funding. Even if OpenAI's revenue grows as its plan says, it runs out of cash in 2028 and needs about $110bn of additional funding before it turns profitable in 2030. If revenue reaches only half of plan (Base), 70% of its compute contracts are fixed, so it never turns profitable and needs more than $500bn of additional funding. The neocloud and data center models (CoreWeave, Stargate, SpaceX/xAI) "build with debt and repay from leases," so in every scenario they need additional borrowing in 2027–28.
| Company | Opening cash | Scenario | Year cash runs out | First positive FCF year | Funding needed | Cumulative FCF to 2030 |
|---|---|---|---|---|---|---|
| ⑨ OpenAI | 150 | Bull / Base / Bear | 2028 / 2028 / 2028 | 2030 / none / none | 109 / 513 / 1,223 | −223 / −392 / −526 |
| ⑩ Stargate (sites) | 10 | Bull / Base / Bear | 2027 / 2027 / 2028 | 2033 / 2033 / none | 81 / 50 / 42 | −78 / −49 / −35 |
| ⑪ CoreWeave | 5.5 | Bull / Base / Bear | 2027 / 2028 / 2028 | 2032 / 2035 / none | 20 / 41 / 67 | −25 / −34 / −33 |
| ⑫ Anthropic | 132 | Bull / Base / Bear | never / never / 2035 | 2027 / 2027 / none | 0 / 0 / 5 | +286 / +109 / −55 |
| ⑬ Mistral AI | 5.5 | Bull / Base / Bear | 2028 / 2028 / 2029 | 2033 / none / none | 6 / 12 / 18 | −11 / −10 / −9 |
| ⑭ SpaceX/xAI | 100 | Bull / Base / Bear | 2027 / 2028 / 2028 | none / none / none | 173 / 251 / 240 | −209 / −210 / −179 |
In billions of dollars. "Year cash runs out" assumes no new equity or debt from now on. "Funding needed" is the maximum cumulative cash shortfall up to that year (through 2035).
The scenario definitions are common to all companies. Bull takes company plans and disclosures at face value. Base assumes revenue reaches 50–70% of plan by 2030 and Bear only 20–40%, while the fixed portion of compute contracts (OpenAI 70%, Anthropic 80%) and existing debt remain. In Bear the funding needed by the startup-type companies falls because they are assumed to stop capex. In that case, the losses shift to the lenders who financed the facilities.
⑨ OpenAI
Even including the $122bn raised in March 2026, annual cash burn rises to about $65bn in 2027 and about $95bn in 2028, so it runs out of money in 2028, as the FT has reported. The biggest swing factor is whether revenue reaches $200–350bn in 2029–30.
⑫ Anthropic
Operating cash flow was already positive in the first half (+$3.9bn), and it holds a thick cushion of $131.7bn in cash. The risk is less about cash than about payments on its compute contracts, including the $245bn signed since, which ramp up from 2028. In Bear it turns cash-negative from 2028.
⑭ SpaceX/xAI
AI capex runs at about $50bn a year, while Grok revenue is a few hundred million dollars. Renting compute to Anthropic and Google is the main source of income, but those contracts can be cancelled on 90 days' notice. The parent SpaceX's rocket and Starlink businesses are the cushion.
⑪ CoreWeave
It is profitable at the operating level, but interest of $640m a quarter takes a quarter of revenue, and it must keep borrowing to fund capex. Its top three customers account for 72% of revenue.
⑩ Stargate
There are no disclosures at the joint-venture level, so this is an estimate that treats the site-level SPVs as one entity. Because it builds with debt and repays from OpenAI's lease payments, it carries OpenAI's risk rather than a risk of its own.
⑬ Mistral AI
Small in scale, with funding needs of $6–18bn. The further it pushes its own compute infrastructure in Europe (1GW by 2030), the more money it needs.
How long does the cash last?
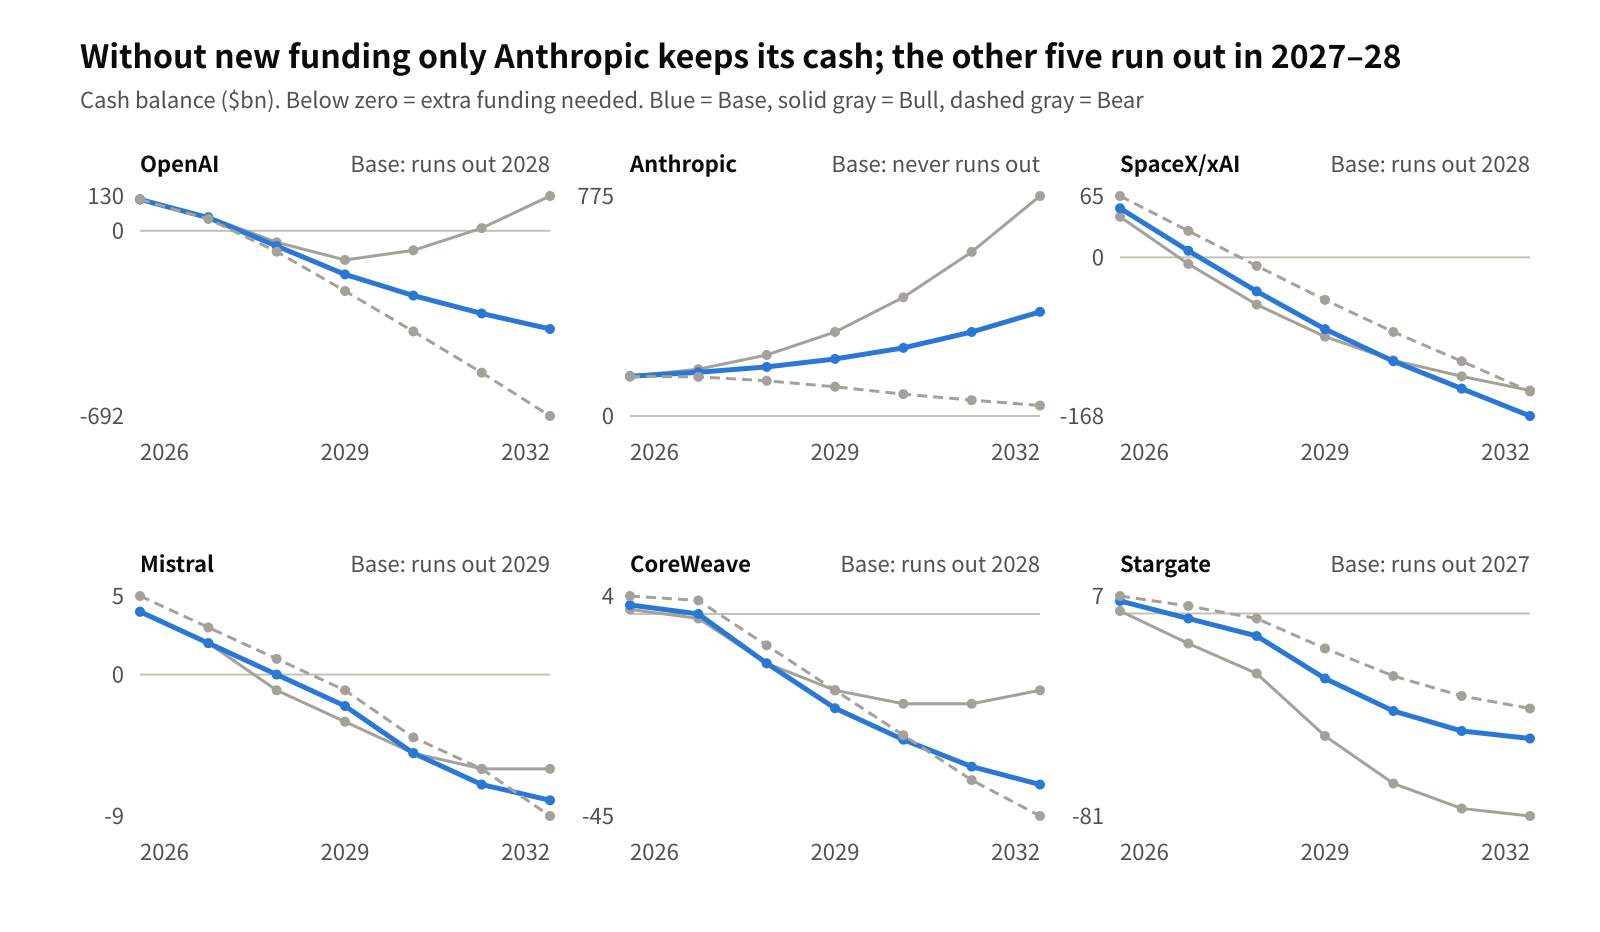
OpenAI and SpaceX/xAI have large deficits, and in Base there is still no bottom in sight in 2030. CoreWeave and Stargate involve smaller amounts but hold only a few months of cash, and every round of capex assumes new borrowing. If the credit markets close, these two would be the first to stop.
Working back from tokens to revenue
Revenue can be broken down into "tokens processed × realized price per token." Prices keep falling by about 30–50% a year (frontier model input prices fell from $10 per million tokens in 2024 to $1.25–3 in 2026), so for revenue to grow 30% a year, token volume needs to roughly double every year. This is the earliest leading indicator available.
We backed out 2026 realized prices by dividing each company's revenue by its estimated token volume (OpenAI about $4.9 per million tokens, Anthropic about $11; Anthropic is higher because coding workloads have a larger share of output tokens and higher prices). Both are estimates.
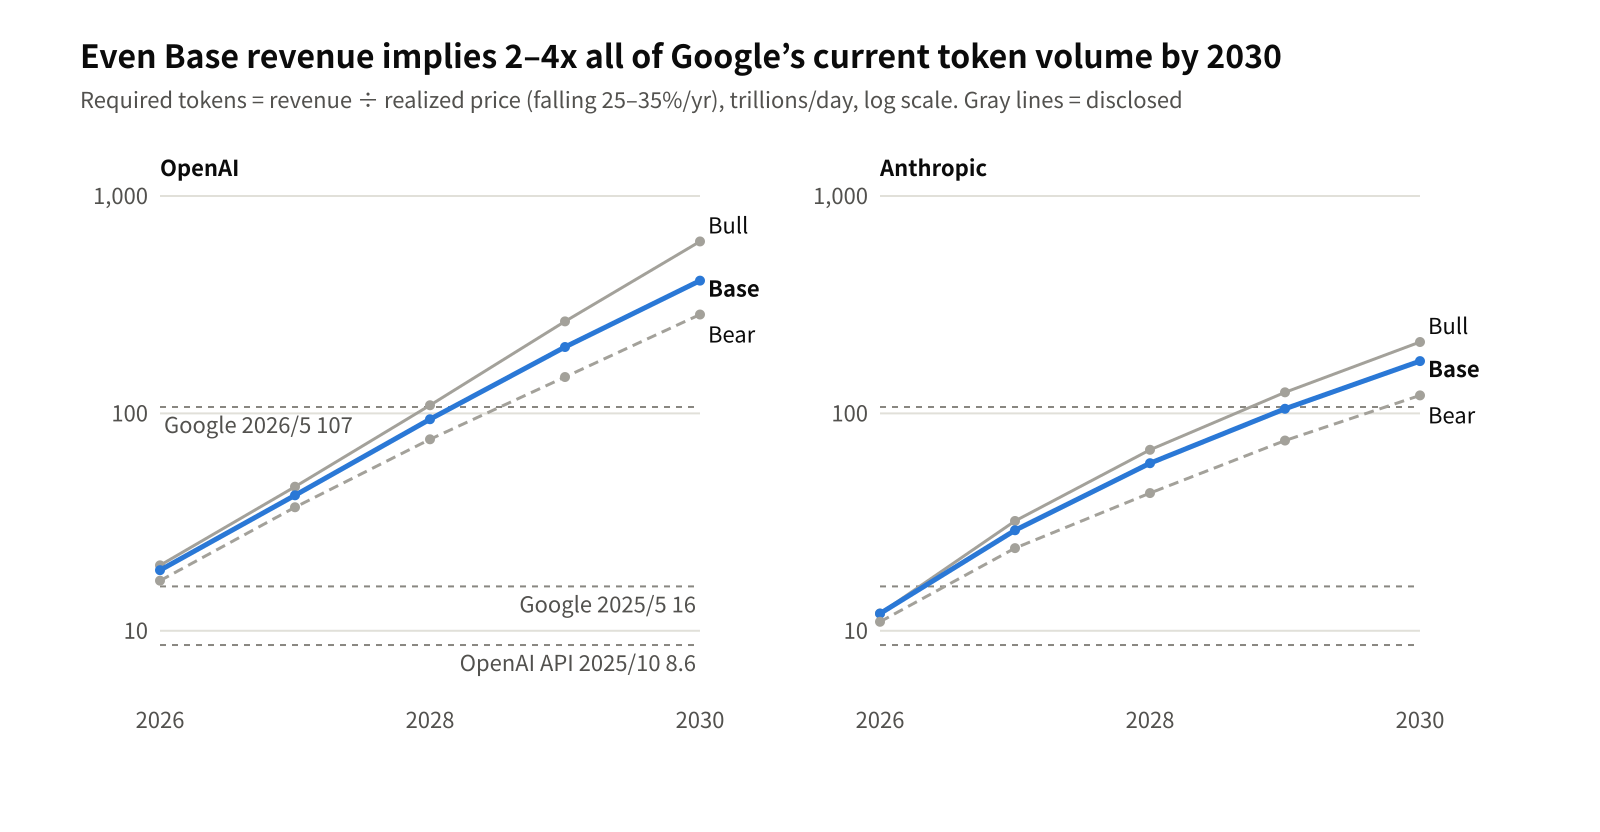
- The required growth is an extension of the track record: OpenAI's Base requires about 400 trillion tokens a day in 2030 (about 20 times today, roughly 2.1x a year). Google's volume grew 7x over the past year, so it is not an impossible number. But Google's monthly increments slowed in the second half of 2025, and whether "2x a year" can be sustained is the key question.
- Price declines are the biggest variable: If prices fall 35% a year, the tokens needed for the same revenue in 2030 are 1.7 times what they would be with a 25% decline. On OpenRouter, open-weight and Chinese models account for about 70% of tokens, adding downward pressure on prices.
- Token growth does not always become revenue: Most of Google's processed tokens come from free use inside Search and Workspace, with realized prices far below $1 per million tokens. The "paid token share" needs to be watched alongside token volume.
Where are the risk points?
Where funding breaks depends on the type of company. The first hump is 2027–28, when OpenAI's next funding round, the ramp-up of Anthropic's committed payments, and CoreWeave's and Stargate's refinancing and new borrowing all coincide.
| Company | First point of failure | Timing | Contagion to |
|---|---|---|---|
| OpenAI | Whether its next funding round (over $100bn) can be done without a lower valuation. If not, the only option is to defer payments to Oracle, Azure and AWS | Late 2027–2028 | Oracle (most of its RPO), Stargate site SPVs, SoftBank (invests with borrowed money), CoreWeave |
| Anthropic | If revenue cannot keep up with fixed payments from 2028 ($70–100bn a year, of which take-or-pay contracts with Google, Amazon and Microsoft total $269.4bn). Access to capital markets after the IPO is the cushion | 2028–29 | Google, AWS and Azure backlogs, the Broadcom lease SPV ($63bn), SpaceX/xAI's rental income |
| SpaceX/xAI | Whether the compute contracts with Anthropic and Google (cancellable on 90 days' notice) continue. If not, $50bn a year of capex depends on rocket and Starlink cash and new borrowing | 2027 | NVIDIA ($40bn of borrowing to buy chips), bond investors |
| CoreWeave | The point at which contract renewals for existing clusters (2–5 years) and SPV refinancing coincide while interest still exceeds operating profit | 2027–28 | Private credit such as Blackstone and Blue Owl, NVIDIA (shareholder and capacity guarantor) |
| Stargate | Dependence on payments from a single tenant (OpenAI). If site completion and OpenAI's fundraising fall out of step, interest accrues before the sites are operating | 2027 | JPMorgan and Japanese banks (site SPV lenders), Oracle, Crusoe, NVIDIA (lease guarantee) |
| Mistral AI | The next funding round. If falling prices erode its differentiation from open-weight models, raising money becomes harder | 2028 | European data center lenders, strategic shareholders such as Samsung |
Two features are common to all of them. First, every company needs one more large round of external funding before turning annually profitable, and that funding is available only while investors believe in the "revenue as planned." Second, if the weakest links (CoreWeave and the Stargate sites) stop, the labs' revenue plans that assume that compute also collapse, so risk travels both up and down the chain.
KPIs to watch
What we want to measure is whether external cash is coming in and whether there is headroom against fixed payments. The revenue and backlog figures each company publishes include intra-group transactions, so on their own they do not show financial health. The warning levels are assumptions set roughly at the boundary between Base and Bear in this model.
| Layer | KPI | How to read it | Warning level (guide) | Where to find it |
|---|---|---|---|---|
| Leading (earliest) | Year-on-year growth in tokens processed | The source of revenue. Base needs 2x a year | Below 1.5x a year | Google I/O and earnings, OpenAI DevDay, Microsoft earnings, OpenRouter weekly data |
| Leading | Paid token share and realized price | Detects token growth that does not turn into revenue | Realized price falling more than 35% a year | Revenue ÷ token volume, API price lists, OpenRouter spend share |
| External revenue | Share of revenue from third-party customers | Revenue from anyone other than investees or investors: cash from outside the loop | Labs above 40% of revenue at clouds and neoclouds | Customer concentration disclosures (CoreWeave top 3 at 72%, Anthropic top 5 at 25%), related-party notes |
| External revenue | Backlog quality | Share of RPO from a single customer or investee, and share converting to revenue within 24 months | Single customer above 40%, or a falling 24-month share | RPO disclosures from Oracle, Microsoft, Google and CoreWeave |
| Liquidity | Runway (cash ÷ annual cash burn) | Time until the next funding round | Under 18 months | S-1s and earnings; for private companies, press reports (FT, The Information) |
| Liquidity | Fixed commitment coverage (revenue ÷ next year's non-cancellable payments) | Only take-or-pay payments go in the denominator. Contracts conditional on delivery or cancellable are tracked separately | Below 1.5x | Contractual obligations table in S-1s, press reports on cloud contracts |
| Balance sheet | Interest coverage (EBITDA ÷ interest) | Headroom for companies that build with debt | Below 2.5x (CoreWeave 2.9x in 2025 and falling) | Quarterly earnings |
| Balance sheet | Total off-balance-sheet debt and guarantees | SPVs, lease guarantees and residual value guarantees that do not appear on the parent's balance sheet | Doubling year on year | Notes to the accounts, rating agency reports, IMF GFSR |
| Balance sheet | Shift in sources of debt | A move from investment-grade bonds → private credit → vendor financing is a red flag | Vendors (NVIDIA and others) step in with guarantees or loans | Funding news, secondary bond prices (SpaceX bonds fell below par right after issuance) |
| Facilities | GPU utilization and resale prices | Collateral value of leases and SPVs | Used H100 hourly rates falling more than 40% a year | GPU rental indices, neocloud utilization disclosures |
Tracking just three of these every quarter gives a fairly accurate read on the direction of the ecosystem: growth in tokens processed (is it still at least 2x a year?), share of revenue from third-party customers (is cash from outside the loop increasing?), and fixed commitment coverage (can next year's payments be covered by revenue?).
Limits of the model
The three inputs that move the results most are revenue growth, the scale of capex, and chip sales outside the group.
- Where the boundary is drawn: The effect of AI in protecting search ad and Office revenue (its defensive value) is not included in end-user revenue. Counting it would improve the results.
- Chip sales outside the group are not reliable either: Purchases by Meta and governments are supported by the same AI investment boom one layer further out. Excluding them widens the cumulative deficit even in Base to about $2.9tn, with no payback by 2040.
- GPU life: GPUs are depreciated over six years. If they actually become obsolete in about four, replacement capex rises and so does the revenue required.
- Linkage between revenue and capex: The strong real-world link, where rising revenue brings more investment, is captured only through the combination of scenarios. In reality, "Bull revenue with Bull capex" tends to come as a package, and a path where only revenue grows while investment is held back seems unlikely.
- Not included: Taxes, working capital, impairments, cascading contract defaults, and drawdowns of cash on hand (such as Anthropic's roughly $130bn).
Sources
Consolidated model
- IMF GFSR October 2026, Figure 1.2 totals (TNW): equity ~$300bn, revenue commitments ~$1.4tn, debt ~$650bn
- OpenAI revenue and cash burn outlook (Reuters/FT, September 2026): revenue $36bn in 2026 → $350bn in 2030; cumulative FCF of −$278bn over 2026–30
- Summary of Anthropic's S-1 (FourWeekMBA): first-half 2026 revenue $16.3bn, cash and equivalents $131.7bn
- NVIDIA Q2 FY27 (May–July 2026) results: revenue $96.2bn, gross margin 75%
- 2026 capex of the major companies (Business Insider/HL, October 30, 2026)
- Analysis of Alphabet's Q3 2026 results (Metir AI): capex guidance $195–205bn, FCF −$9.1bn
- Microsoft January–March 2026 results (GeekWire): AI business annual run rate $37bn, RPO $627bn
- Oracle's funding plan (FourWeekMBA): FY26 FCF −$23.7bn, RPO $664bn
- Bain estimate (PYMNTS, September 2025): $2tn of annual revenue needed by 2030, an $800bn shortfall
- Sources for individual deals: "Key deals: the facts" on the circular financing map page
Company models (⑨–⑭)
- OpenAI's annual FCF forecast and cash balance (The Decoder)
- Key points of Anthropic's S-1 (BuildMVPFast)
- Anthropic's contractual obligations (Xenospectrum)
- SpaceX/xAI Q2 2026 (Tom Tunguz)
- xAI's 2025 financials (TechCrunch)
- Mistral AI revenue and funding (Presenc)
- CoreWeave Q2 2026 (Beancount)
- CoreWeave's interest bill and coverage (TIKR)
- Stargate progress (FourWeekMBA)
- Google at 3,200 trillion tokens a month (GIGAZINE), token volumes by company (Robonomics)
- OpenRouter token share analysis, API price trends (Deploybase)