The AI Ecosystem at a Glance · 3/4
AI Ecosystem Stress Test Model: Quarterly Tests and Monthly Checkpoints
This is the first version of a model that runs six kinds of shock through the circular financing loop every quarter and shows whose funding breaks, when, and how much spills over to whom, rated on a five-step magnitude scale (M1–M5). Its starting point is the consolidated cash flow model (Base, Bull and Bear).
- Quarterly stress test: Six shocks (demand, token prices, credit market shutdown, GPU refresh cycle, counterparty failure, guarantee calls) at three severity levels, plus a combined scenario, are applied to eight quarters of cash for nine funding-constrained players.
- Four outputs: risk points (the quarter cash runs out and the shortfall), magnitude, the gap versus stock prices, and items to watch.
- Monthly checkpoint: 10 leading indicators are checked against thresholds. One red or three yellows trigger an ad hoc stress test.
- What the dry run shows: Demand and price shocks do not break anyone's funding within eight quarters; funding-side shocks (credit shutdown, shorter GPU life) do. The combined scenario has a total impact of about $419bn (M5).
This page sets out the design of the model. Actual test results are listed on the reports page, which links to each run.
The figures on this page are model estimates based on our own estimates and assumptions from public information. Shock sizes, loss rates and probabilities are v1.0 assumptions. They do not forecast or guarantee future results or market developments, and this is not investment advice. Unless otherwise noted, figures are in US dollars ($bn = billions).
Model structure and versioning
Three models are used as layers. The annual consolidated cash flow model supplies the assumptions. The quarterly stress test shocks those assumptions to find where things break. The monthly checkpoint decides whether an unscheduled test should be run.
| Layer | Frequency | Question | Inputs | Outputs |
|---|---|---|---|---|
| Annual consolidated CF model (page 2) | Once a year, plus major deals | Can the ecosystem stand on its own? | Earnings, disclosures, press reports | Annual CF for Base/Bull/Bear, required revenue, KPIs |
| Quarterly stress test | Preliminary early, full late in the second month after quarter-end | If a shock hits, whose funding breaks, when, and who is hit next? | Annual-model Base, shock parameters, exposure table | Risk points, magnitude (M1–M5), gap vs. stock prices, items to watch |
| Monthly checkpoint | Early each month | Has a leading indicator crossed its threshold? Is an ad hoc test needed? | Actual values of 10 leading indicators | Signals (green/yellow/red), trigger decision |
The versioning rules are designed so that readers can always tell which version and which run they are looking at.
- Model version:
v<major>.<minor>. Changes to parameter values or thresholds raise the minor number (v1.1, v1.2); adding a shock or a player, or changing a formula, raises the major number (v2.0). This page describes v1.0. - Quarterly test run ID:
ST-<year>Q<quarter>-<seq>. The preliminary version is 01, the full version 02, and ad hoc tests 03 onward. For example, July–September 2026 isST-2026Q3-01(preliminary) andST-2026Q3-02(full). - Monthly checkpoint run ID:
CP-<year>-<month>, e.g.CP-2026-12. - Runs are frozen: Each run records the model version, the annual-model version and the data cut-off date in the run log, and that row is never edited after publication. Corrections are made in the next run ID.
- Publication units: Each quarter we publish the run ID, result tables and items to watch; each month, the signal table. Revisions to the annual model are announced separately.
Scope: funding layer and exposure layer
The model splits players into two layers. Quarterly cash is tracked only for the nine players that have no legacy business to fall back on and would stop within a few quarters if funding dried up. Everyone else is measured by how much they would lose if those nine stopped: exposure (equity, backlog, loans, guarantees) × loss rate. Peripheral players such as Fluidstack, TeraWulf, Blue Owl, banks and memory makers sit in this second layer.
Funding layer (nine players whose quarterly cash is tracked)
| Player | Type | Why it is tracked | Source of assumptions |
|---|---|---|---|
| ⑨ OpenAI | AI lab (loss-making, relies on large raises) | In the annual model its cash runs out in 2028 in every scenario. The biggest node in the loop | Company CF model (Base) |
| ⑫ Anthropic | AI lab (profitable, large fixed commitments) | Cash is ample, but fixed payments from 2028 ($70–100bn a year) are exposed to a revenue drop | Same |
| ⑪ CoreWeave | Neocloud (builds with debt) | Interest is about a quarter of revenue and cash covers a few months. First to stop if debt markets close | Same |
| ⑩ Stargate site SPVs | Site SPVs (single tenant) | OpenAI's payments are the only source of repayment. A gap between completion and funding means interest falls due first | Same |
| ⑭ SpaceXAI | Lab and lessor (parent provides a cushion) | $50bn a year of capex supported by leasing contracts cancellable on 90 days' notice and $40bn of new borrowing | Same |
| ⑬ Mistral | Smaller lab | Amounts are small, but a stalled next round would hit European site financing | Same |
| ⑧ Oracle (AI unit) | Investor that builds with debt | Most of its $664bn RPO is OpenAI. $18bn bonds + $38bn loans + $45–50bn more to raise in 2026 | Deal list converted to quarters (new in v1.0) |
| ⑤ SoftBank Group | Investor funding stakes with debt | Invested in OpenAI with a $40bn bridge loan. A lower OpenAI valuation hits refinancing and LTV directly | Same |
| Other neoclouds (aggregate) | Nebius, Nscale, Lambda, Crusoe, Fluidstack, TeraWulf | Buy GPUs with debt against contracts with Anthropic, Microsoft and Meta. Same model as CoreWeave, with many delivery-contingent contracts | Aggregated from press reports (new in v1.0, low precision) |
Exposure layer (who absorbs the losses)
| Layer | Players | Exposure held | Channels |
|---|---|---|---|
| Investors/suppliers (①–⑧) | NVIDIA, Microsoft, Amazon, Alphabet, AMD, Broadcom, Oracle, SoftBank | Equity (about $300bn), backlog and purchase commitments (about $1.4tn), guarantees (NVIDIA up to $105bn, Broadcom residual value guarantee) | C1 write-downs, C2 lost backlog, C3 guarantee calls, C4 lower chip demand |
| Lenders: banks | JPMorgan, Goldman Sachs, BofA, Citi, Morgan Stanley, Mizuho, SMBC, MUFG | SoftBank $40bn bridge, Stargate site SPVs (Abilene about $10bn, New Mexico $18bn), senior tranche of the Anthropic chip SPV | C3 SPV default, C5 falling collateral value |
| Lenders: private credit | Blackstone, Blue Owl, Apollo, Pimco, KKR, Brookfield | CoreWeave debt (about $35bn), SpaceXAI's $40bn chip loan, Meta Hyperion JV ($27bn), junior tranches of SPVs | C3, C5 |
| Guarantors and vendor finance | NVIDIA, Broadcom, AMD (warrants) | Lease guarantees, residual value guarantees, capacity guarantees | C3 guarantee calls, C4 |
| Site developers and power | SB Energy, Vantage, Crusoe, Related | Rent receivables on long-term leases, construction loans | C2 tenant stops paying |
| Component suppliers | TSMC, SK hynix, Samsung, Micron | Chip and memory orders and capacity expansion | C4 lower chip demand (final recipients) |
The exposure table has four columns, "who, to whom, in what form, how much," copied straight from the deal list on the circular financing map page. When a new deal is announced, adding a row feeds it into the transmission calculation.
Shock definitions: six shocks × three levels, plus a combined scenario
There are four kinds of shock: those that stop cash coming in (S1, S2), those that stop funding (S3), those that increase cash going out (S4, S6), and those where someone inside the loop stops (S5). All are defined as deviations from the annual model's Base, and the test horizon is eight quarters (e.g. October 2026 to September 2028). The values below are v1.0 defaults.
| ID | Shock | Variable moved | Light (L1) | Medium (L2) | Severe (L3) | Historical reference |
|---|---|---|---|---|---|---|
| S1 | Demand shock | End-user revenue vs. Base (reached linearly over four quarters, then flat). Labs' fixed share of compute costs stays (OpenAI 70%, Anthropic 80%) | −10% | −25% | −40% | The Bear scenario is −26% vs. Base in 2028. Corporate IT spending fell about 15% over two years after the dot-com bust |
| S2 | Token price shock | The annual decline in realized unit price accelerates from Base's 35%. Assuming volume offsets half, lab revenue is lower by the stated rate in the final quarter. Neocloud GPU rental rates fall by the same rate | −10% (price −45%/yr) | −22% (−55%/yr) | −35% (−65%/yr) | Frontier input prices fell from $10 to $1.25–3 per million tokens in 2024→26. H100 hourly rates fell about 50% in 2024 |
| S3 | Credit market shutdown | Quarters with no new borrowing, refinancing rate on maturing debt, spread widening, success rate of equity raises | 2 quarters, 75% refinanced, +150bp, 75% equity | 4 quarters, 50%, +300bp, 50% | 6 quarters, 25%, +500bp, 25% | HY issuance stopped for about five months in 2008; tech IPOs stopped for about nine months in 2022 |
| S4 | Shorter GPU refresh cycle | Useful life shortened from six years. Capex rises and collateral/residual values fall for GPU-owning players (CoreWeave, neoclouds, SpaceXAI, Stargate, Oracle) | 5 years, capex +20%, residual −20% | 4 years, +50%, −40% | 3 years, +100%, −60% | Annual-model sensitivity: no payback at four years. Used H100s are about 40% cheaper after one year |
| S5 | Counterparty failure | Share of payments to suppliers deferred by a chosen player (default: OpenAI; CoreWeave and SpaceXAI selectable) that cannot raise funds. Its own cash rises and its suppliers' revenue falls | 25% deferred | 50% | 100% (payments stop) | OpenAI's payments are most of Oracle's RPO, all of the Stargate SPVs' revenue and about 20% of CoreWeave's backlog |
| S6 | Guarantee calls | Share of NVIDIA's lease guarantees (up to $105bn) and Broadcom's residual value guarantee ($63bn SPV) that is called, paid over four quarters | 10% called | 25% | 50% | Guarantees appear only in footnotes until called. When called, they come out of the vendor's free cash flow |
| S7 | Combined (wrong-way risk) | S1 (L2) + S3 (L2) + S5 (OpenAI, L2) at once: the IMF's case of write-downs, repayment difficulties and broken commitments happening together | — | — | Fixed | Demand weakening as funding closes was common to 2000, 2008 and 2022 |
Each shock carries a probability (v1.0 defaults: Base continues 55%, L1 25%, L2 15%, L3 5%). These probabilities are used only to measure the gap versus stock prices. When a monthly checkpoint signal turns yellow or red, the probability of the related shock is raised.
Transmission channels: six paths through the loop
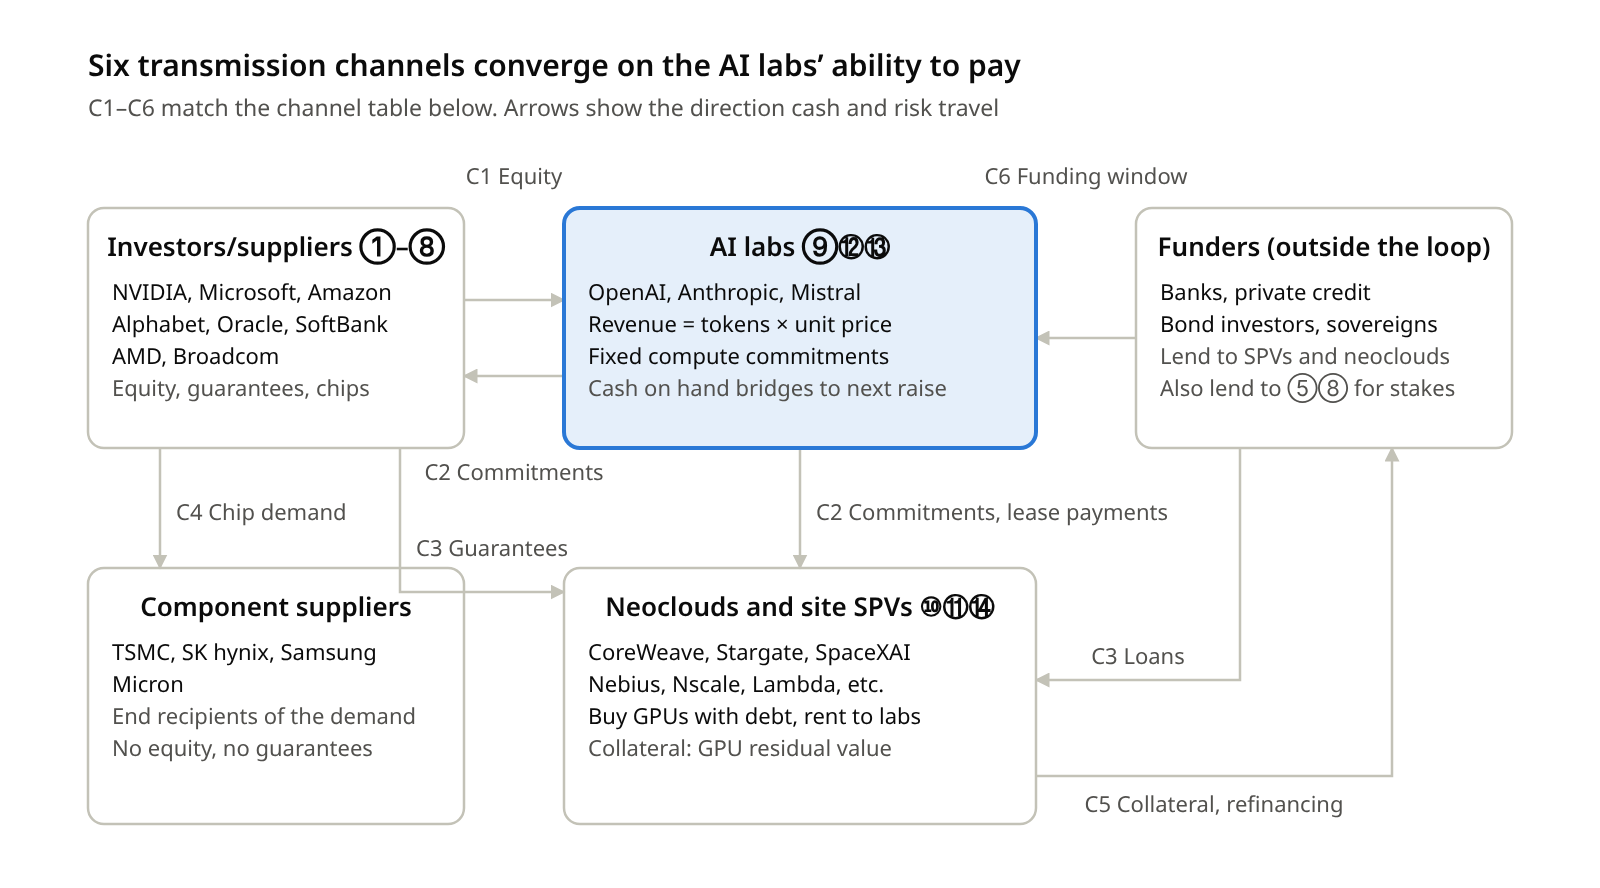
Wherever a shock enters, it ends up at the same question: can the AI labs pay as promised? From there it flows back along three lines (equity C1, purchase commitments C2, debt and guarantees C3) to investors, lenders and component suppliers. In the calculation, the six channels are implemented as the exposure type (equity, commitment, loan, guarantee) multiplied by a signal factor.
| Channel | What travels | Entry shocks | Exit (who takes the loss) | Treatment in the calculation |
|---|---|---|---|---|
| C1 Equity → write-downs | When a lab's funding breaks, investors' stakes are written down. SoftBank funded its stake with debt, so this hits its collateral directly | S1, S2, S3, S5 | Investors ①–⑧, SoftBank's lenders | Equity × loss rate × signal factor |
| C2 Commitments → lost backlog | Deferred lab payments wipe out revenue and backlog (RPO) at clouds, neoclouds and SPVs | S5, S1 | Oracle, Microsoft, Amazon, Alphabet, CoreWeave, Stargate, SpaceXAI | Commitment × loss rate; in the funding layer, revenue share × deferral rate |
| C3 Debt and guarantees → SPV default, guarantee calls | Site SPVs and neoclouds repay only from lab payments. If those stop, lenders take losses and NVIDIA's and Broadcom's guarantees are called | S3, S5, S6 | Banks (including Japanese banks), private credit, guarantors | Loan × loss rate; guarantee × call rate |
| C4 Chip demand → components | Capex cuts and delays spill over to chip, memory and foundry orders. The layer that neither invests nor guarantees is hit last | S1, S4, S5 | TSMC, SK hynix, Samsung, Micron | Component commitments × loss rate |
| C5 Collateral value → failed refinancing | Falling GPU residual values and rental rates push up LTV on GPU-backed loans and stop refinancing | S4, S2, S3 | Neoclouds, site SPVs and their lenders | Capex increase; residual-value decline added to loan loss rate |
| C6 Funding window → valuation, failed rounds | When markets close, the next round fails and labs defer payments: a self-reinforcing loop back into C2 and C3 | S3 | Labs, then every channel | Planned equity × success rate; planned debt × shutdown flag |
How a quarterly test is calculated
Each test has five steps. Only steps 1 and 2 take inputs; the rest is calculated automatically.
- Update inputs: Split the annual model's Base into quarters and correct opening cash and planned funding (debt, equity, IPO) with the latest results and disclosures. Annual values are interpolated linearly between mid-year quarterly run rates.
- Choose shocks: Set a level from 0 to 3 for S1–S6. For a combined scenario, set several at once. For S5, choose the counterparty (OpenAI, Anthropic or CoreWeave).
- Calculate funding: Compute cash balances for nine players × eight quarters. This gives minimum cash, the first quarter cash turns negative (the risk point), the shortfall and the signal (green/yellow/red).
- Calculate transmission: Multiply each row of the exposure table by the counterparty's signal factor (red = 1, yellow = 0.25, green = 0) and the loss rate to get losses for investors, lenders, guarantors and component suppliers.
- Output: Review the risk point table and magnitude, record the results and log the run ID.
Each player's cash in quarter q (1–8) is calculated as follows. r is the shock progression factor (q/4, capped at 1), and the shutdown flag cq is 1 if q is within S3's number of shutdown quarters.
Cashq = Cashq−1 + Revenueq + Deferralq − Costq − Capexq − Interestq − Repaymentq + Fundingq
Revenueq = RevenueBaseq × (1 − D·r) × (1 − P·r·π) × (1 − sCP·F)
Costq = ComputeBaseq × {φ + (1 − φ)(1 − D·r)} + OpexBaseq
Capexq = CapexBaseq × (1 + g·U) Interestq = InterestBaseq × (1 + bp/650)
Repaymentq = Maturitiesq × {1 − (1 − RO)·cq} Fundingq = Planned debtq × (1 − cq) + Planned equityq × {1 − (1 − ER)·cq}
Where D = demand decline (S1), P = revenue decline from unit prices (S2), π = 1 if the player is exposed to unit prices, sCP = share of revenue from the counterparty, F = payment deferral rate (S5), φ = fixed share of compute costs, g = 1 for GPU-owning players, U = capex increase (S4), bp = spread widening, RO = refinancing rate, ER = equity raise success rate, cq = shutdown flag. The deferral effect applies only to the counterparty chosen in S5, whose cash rises by the amount it stops paying.
The signal is red if minimum cash is negative, yellow if it is below half of one quarter's cash outflow (cost + capex + interest), and green otherwise. Transmission losses are exposure × signal factor × loss rate, with the loss rate set by the highest level applied (equity 25/45/60%, commitments 10/20/30%, loans 20/35/50%, guarantees 10/25/50%; loans to GPU-owning players add half of S4's residual-value decline). For guarantees, the higher of this rate and S6's call rate is used.
Output definitions: risk points, magnitude, gap vs. stock prices, items to watch
Four results are published, in this order: stress test results → risk points and magnitude → gap versus stock prices → items to watch.
| Output | Definition | Published as |
|---|---|---|
| 1. Risk points | For each player, the first quarter cash turns negative and the shortfall (absolute value of minimum cash). For players already red in Base, read the additional shortfall vs. Base | Table of player × (quarter, shortfall, signal) |
| 2. Magnitude | Total impact T = additional funding need (vs. Base) + exposure-layer losses, classified M1–M5 | Grade and the amount of T |
| 3. Gap vs. stock prices | For each listed holder, model expected loss (Σ probability × scenario loss) minus the loss priced in by the market (market cap × decline since the reference date). Positive means the market is more optimistic than the model | Table of holder × (expected loss, priced in, gap) |
| 4. Items to watch | For players at yellow or red, the events to check before the next quarter (raises, refinancing, contract renewals, payment schedules) | Bullet list, also checked in the monthly checkpoint |
Magnitude scale (v1.0)
Amounts are in $bn. If an additional condition is met, the grade is at least that level regardless of the amount.
| Grade | Total impact T | Additional condition | Meaning |
|---|---|---|---|
| M1 | Under 25 | No player newly red | Within Base. Update items to watch only |
| M2 | 25–75 | — | Local. Track funding at the affected players monthly |
| M3 | 75–150 | — | Spreads to part of the loop. Show lender and guarantor losses explicitly |
| M4 | 150–300 | Or one AI lab (OpenAI, Anthropic) newly red | Structural. Assume hyperscalers revise backlog and capex plans |
| M5 | Over 300 | Or two labs newly red | Systemic. The IMF's wrong-way risk materializes |
The scale is anchored on the ecosystem's 2026 external revenue of about $330bn and the annual model's yearly cash shortfall of about $320bn. A T above 300 means "another full year of shortfall on top of the existing one."
How the gap versus stock prices is measured
v1.0 uses the following simple method. Market inputs are entered by hand each time.
- Assign the shock probabilities (Base 55%, L1 25%, L2 15%, L3 5%) to representative scenarios (Base, S1-L1, S7, S3-L3).
- For each listed holder (NVIDIA, Microsoft, Amazon, Alphabet, Oracle, Broadcom, AMD, SoftBank, CoreWeave), calculate expected loss = Σ probability × scenario loss.
- Enter the decline in market cap since the reference date (the previous test) and the change in bond spreads, and compute the loss priced in by the market = market cap × decline.
- Gap = expected loss − loss priced in. A positive gap means the market is more optimistic than the model. Holders with the largest gaps are added to the items to watch first.
This method is limited because stock prices also move for reasons unrelated to AI. In v1.1 we plan to replace the decline with the excess decline of an AI basket over the broad market, and to back out market-implied default probabilities from bond spreads for comparison with the model's probabilities.
v1.0 dry run: total impact by shock
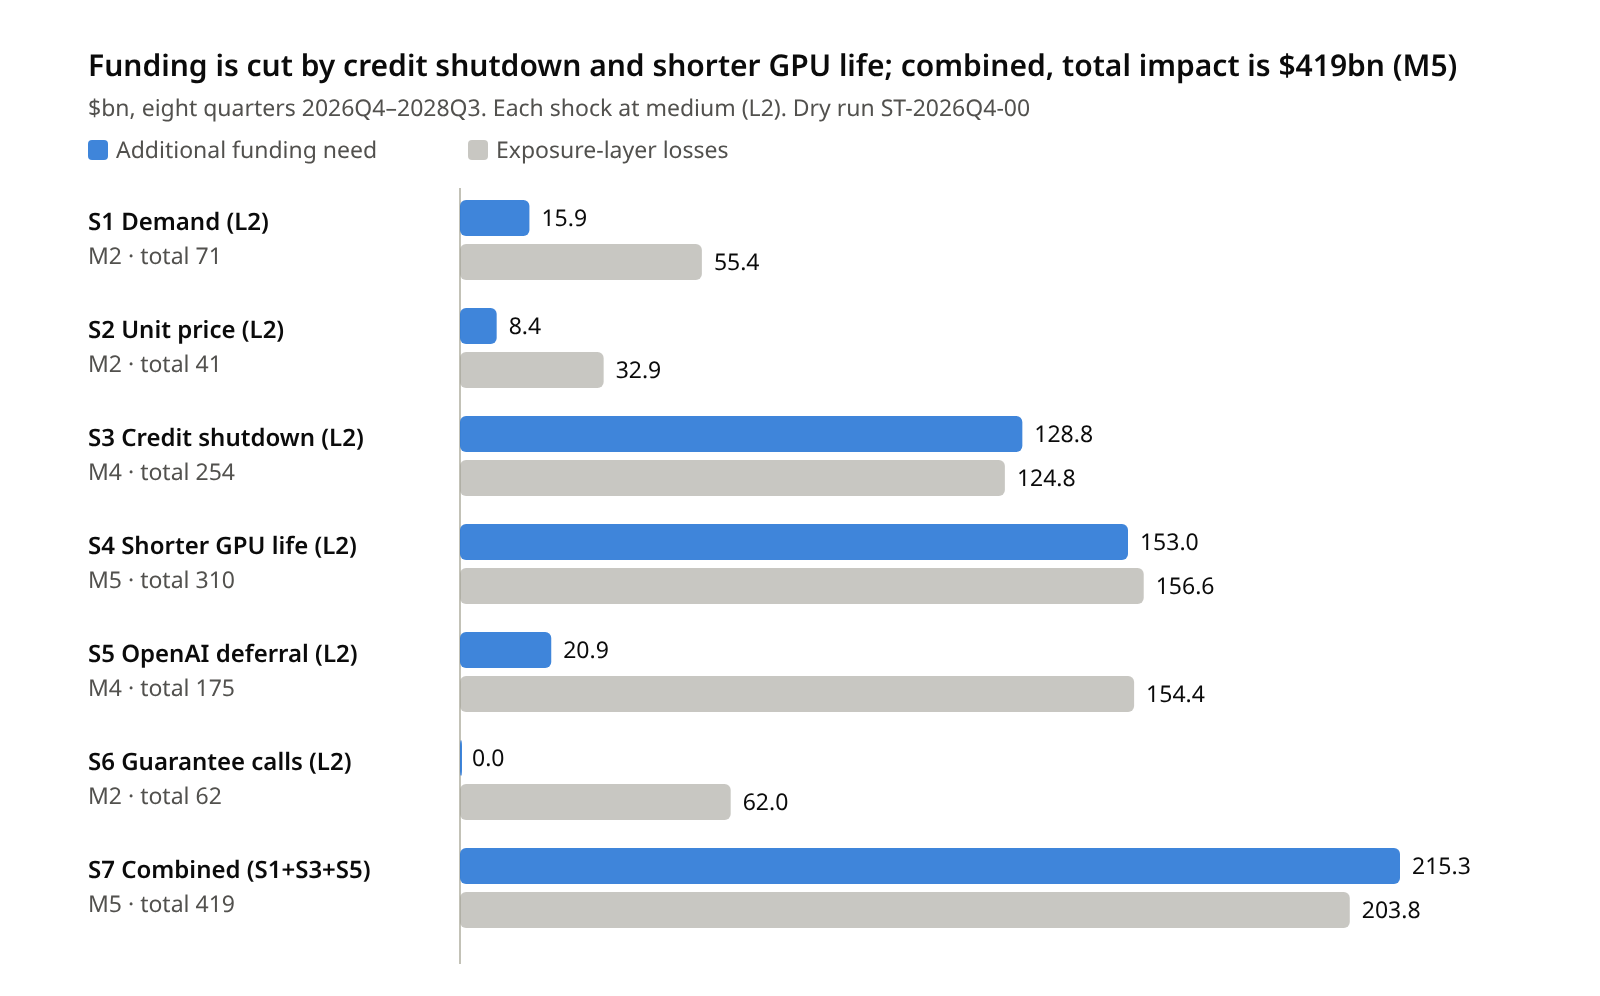
To check that the model works, we ran Base and 22 scenarios (three levels each of S1–S6, the combined S7, and two S5 variants with CoreWeave and the Anthropic chain as counterparty). This is the dry run ST-2026Q4-00, not a regular test based on the latest earnings.
Four things stand out.
- Demand and price shocks do not break funding within eight quarters: At medium (L2), S1 and S2 newly turn only CoreWeave and Oracle (AI unit) red; the labs get by on cash. The damage shows up mainly as write-downs and lost backlog in the exposure layer. This is consistent with the annual model's finding that "even if revenue misses the plan, cash lasts until 2028."
- Funding-side shocks are what break funding: In S3 credit shutdown (L2: four quarters closed, 50% refinanced), CoreWeave, Stargate, Oracle (AI unit), SoftBank and the neoclouds turn red in 2026Q4–2027Q1 and SpaceXAI in 2028Q1, with an additional funding need of $129bn. In S4 shorter GPU life (L2: four years, capex +50%), all five GPU-owning players turn red, which alone is M5.
- OpenAI's payment deferral (S5) saves itself and breaks others: Deferral raises OpenAI's cash, but Oracle (AI unit) turns red in 2027Q3 and Stargate in 2028Q1. Most of the loss falls on Oracle's purchase commitment ($300bn) and the site SPVs' lenders. With CoreWeave as counterparty, total impact stays at $27bn (M2); via the Anthropic chain (deferring payments to SpaceXAI and neoclouds), it is $102bn (M3).
- Combined S7 (demand −25%, credit closed for four quarters, OpenAI defers 50%) is M5: An additional funding need of $215bn in the funding layer and $204bn of exposure-layer losses give a total impact of $419bn. By holder, the largest losses are Oracle $33bn, Microsoft $25bn, bond investors $15bn, the bank syndicate including Japanese banks (SoftBank bridge) $14bn, private credit such as Apollo $14bn, and Amazon $14bn.
Risk points for the combined S7 are below. CoreWeave, red even in Base, shows, as in the annual model, that "planned borrowing alone falls short in 2027Q4," so it is on the watch list with or without a shock.
| Player | Base | S7 combined | Quarter cash runs out (S7) | Shortfall (S7, $bn) |
|---|---|---|---|---|
| ⑧ Oracle (AI unit) | Green | Red | 2026Q4 | 69.0 |
| ⑪ CoreWeave | Red (2027Q4, 8.0) | Red | 2026Q4 | 51.6 |
| ⑭ SpaceXAI | Green | Red | 2028Q1 | 37.3 |
| ⑩ Stargate site SPVs | Yellow | Red | 2026Q4 | 34.0 |
| Other neoclouds (aggregate) | Green | Red | 2027Q1 | 25.6 |
| ⑤ SoftBank Group | Green | Red | 2027Q1 | 5.8 |
| ⑨ OpenAI | Green | Green (cash up from deferral) | — | 0 |
| ⑫ Anthropic | Green | Green | — | 0 |
| ⑬ Mistral | Green | Green | — | 0 |
Dry-run figures depend on the model's defaults (Base inputs, shock sizes, loss rates). In particular, the inputs for Oracle (AI unit) and the aggregate neoclouds are new estimates in v1.0 and should be replaced with reported figures before the regular tests.
Monthly checkpoint: 10 leading indicators and trigger rules
The monthly checkpoint does not run the model. It only compares 10 leading indicators with thresholds and issues a signal (green/yellow/red). The indicators are chosen from the variables the annual model found to be observable earliest (token volume, unit price, fixed commitments) and the variables that serve as entry points for the six shocks, and all can be tracked from public information. Thresholds are v1.0 defaults, set around the boundary between the annual model's Base and Bear.
| # | Leading indicator | Yellow | Red | Related shock | Data sources | Update frequency |
|---|---|---|---|---|---|---|
| 1 | Tokens processed, year on year | Below 1.7× | Below 1.5× | S1 demand | Google I/O and earnings, OpenAI DevDay, Microsoft earnings, OpenRouter weekly | Monthly (OpenRouter), quarterly (disclosures) |
| 2 | Annual decline in realized unit price | Over 35% | Over 50% | S2 price | API price lists, OpenRouter spend share, revenue ÷ estimated tokens | Monthly |
| 3 | GPU rental index (H100 hourly rate), 3-month change | Below −20% | Below −35% | S2 price, S4 refresh | GPU rental price indices, neocloud utilization disclosures | Monthly |
| 4 | AI-related credit spreads, 1-month change | Over +150bp | Over +300bp, or no new issuance for four weeks | S3 credit | Secondary yields on Oracle, CoreWeave and SpaceX bonds, CDS, HY indices | Monthly (weekly possible) |
| 5 | AI lab valuation in latest round vs. previous | Below 1.1×, or more than three months behind plan | Below 1.0× (down round) | S3 credit, S5 counterparty | Funding reports (FT, The Information), S-1s and disclosures | Monthly (as they occur) |
| 6 | Hyperscaler capex guidance revisions | Cut of more than 10% | Cut of more than 20%, or new sites halted | S1 demand, S4 refresh | Microsoft, Amazon, Alphabet, Meta and Oracle earnings | Quarterly (updated in earnings months) |
| 7 | Share of cloud/neocloud revenue from AI labs | Over 40% | Over 50% | S5 counterparty | CoreWeave, Oracle and Nebius disclosures, related-party notes, RPO breakdowns | Quarterly |
| 8 | DRAM contract prices, month on month | Below −10% | Below −20% | S1 demand (spillover to components) | TrendForce, SK hynix and Micron guidance | Monthly |
| 9 | AI stock basket, decline from peak | Below −20% | Below −30% | Gap vs. stock prices | Share prices of NVIDIA, Microsoft, Oracle, CoreWeave, Broadcom, AMD, SK hynix, Micron, SoftBank | Monthly (daily possible) |
| 10 | Negative rating/lending events (this month) | 1 | 2 or more | S3 credit | S&P, Moody's, Fitch; reports of covenant breaches, withdrawn loans, cancelled SPV financing | Monthly |
There are four trigger rules.
- Ad hoc stress test: In any month with at least one red or three yellows, run an ad hoc test within 10 business days (the run ID takes the next number in the quarter). Raise the related shock by one level, recalculate and publish the results.
- Probability review: If the same indicator is yellow for two months in a row, shift probability for the related shock from L1 toward L2 (e.g. L1 25%→20%, L2 15%→20%). This moves the gap versus stock prices.
- Normal months: In a month with no yellow or red, publish only the signal table. Regular quarterly tests run regardless of signals.
- Threshold revisions: Thresholds are reviewed together at the quarterly test, the minor version is raised, and the change is logged. They are not changed mid-month.
Even three of the indicators (1, 4 and 5) cover the biggest variables in the annual model: the source of revenue (tokens), the funding window (credit), and the moment the self-reinforcing rise in valuations stops (a down round).
Operating calendar and publication format
Quarterly tests are published in two stages: a preliminary version early in the second month after quarter-end, based on the earnings disclosures available by then, and a full version late in that month reflecting all players' results (e.g. July–September → preliminary in early November, full in late November). This is because some players report late, such as NVIDIA (about eight weeks after quarter-end) and CoreWeave (about six weeks). The monthly checkpoint reviews the previous month early each month.
| When | Run | Example run ID | What is published |
|---|---|---|---|
| Early each month | Monthly checkpoint | CP-2026-12 | Signal table (10 indicators × green/yellow/red) and trigger decision |
| Early in the second month after quarter-end (Feb, May, Aug, Nov) | Quarterly stress test (preliminary) | ST-2026Q3-01 | Risk point table, magnitude, gap vs. stock prices, items to watch |
| Late in the second month after quarter-end (Feb, May, Aug, Nov) | Quarterly stress test (full) | ST-2026Q3-02 | Same tables, adding results not yet reported and measured monthly indicators |
| When triggered (within 10 business days) | Ad hoc stress test | ST-2026Q3-03 | Same tables as the regular test, opening with the reason (which indicators are red or yellow) |
| Once a year (November) and on major deals | Revision of the annual model and the map | Consolidated CF v2 | Updated annual-model page; Base inputs for the stress test replaced |
Results use the same table layout every time, because most of the value of repeated publication comes from readers being able to compare with the previous run.
- Quarterly tables: Run ID, model version and data cut-off first. Then magnitude and total impact by scenario (with the previous run alongside). Then the risk point table (player × quarter × shortfall × signal). Finally the gap versus stock prices and items to watch.
- Monthly table: One table with this month's value, last month's value and the signal for each of the 10 indicators, plus the trigger decision. Only signals that changed get a short note.
- Language: The Japanese and English versions use the same tables, with shared symbols for indicators, shocks and runs (S1–S7, M1–M5, ST-, CP-).
- Disclaimer: Every release states that it is based on estimates and assumptions from public information and is not investment advice, and gives the sources and the model version.
Spreadsheet structure
The model is implemented as a spreadsheet with live formulas: changing an input cell recalculates everything from funding to outputs.
| Sheet | Role | Inputs |
|---|---|---|
| README | Version, procedure, color conventions | — |
| Run_Log | Record of runs; rows are never edited after publication | Run ID, date, version, data cut-off, results, notes |
| Inputs_Base | Revenue, costs, capex, interest, repayments and planned funding for nine players × eight quarters, plus player parameters | Updated with the annual model and at earnings |
| Shocks | Levels and parameters for S1–S6, S5 counterparty, loss rate table, probabilities, presets | Levels changed for each test |
| Exposure | Who holds what exposure to whom, in what form and how much (44 rows) | Add rows for new deals |
| Calc | Quarterly funding calculation and summary | None (calculation only) |
| Transmission | Losses per exposure, aggregated by holder and layer | None |
| Output | Risk point table, magnitude, items to watch | Base shortfall (updated with the annual model) |
| Results_Scenarios | Results by scenario and losses by holder | Output values appended after each run |
| Market_Gap | Gap between listed holders' expected losses and what the market has priced in | Market cap, change since reference date, spread change |
| Monthly_Checkpoint | Thresholds, current values, signals and trigger decision for the 10 indicators | This month's and last month's values |
| Changelog | Change history by version | Appended at each revision |
Three caveats apply to the inputs. Inputs_Base is a mechanical quarterly split of the annual model's Base, and the three players new in v1.0 (Oracle's AI unit, SoftBank and the aggregate neoclouds) are low-precision estimates. Planned funding (such as OpenAI's $40bn in 2027Q2 and $50bn in 2028Q1) is placed in quarters based on press reports, and this is what moves the results most. Exposure amounts are from press reports and include "up to" and conditional figures; equity stakes are marked to the latest valuations.
Limits of v1.0 and next steps
The first version puts getting the structure in place and running ahead of precision, favoring reproducibility and ease of updating. The points to fix through use are listed below, largest impact first.
| Limit | Impact | Planned fix | Version |
|---|---|---|---|
| Placeholder funding plans | OpenAI's 2027 and 2028 rounds, SpaceXAI's $40bn loan and others are placed in quarters from press reports. This moves results the most | Replace with actual raises each quarter. Standardize "funding delayed six months" as S3 light | v1.1 |
| Inputs for Oracle (AI unit), SoftBank and aggregate neoclouds | Three players not in the annual model were added, so precision is low. Oracle's revenue includes headroom from its legacy business | Rebuild Oracle from the OCI segment and funding plan, SoftBank from LTV and the maturity schedule, and neoclouds around listed Nebius's disclosures | v1.1 |
| Transmission stops after one round | The calculation stops when red in the funding layer becomes losses in the exposure layer; there is no second-round effect of investors who took losses halting their next investment | Add one loop: "if investor losses exceed a threshold, cut the labs' planned equity" | v2.0 |
| Loss rates (LGD) and signal factors are assumptions | Equity 25/45/60% and similar are historical rules of thumb, and absolute transmission losses scale with them | Calibrate over time against actual write-downs and spread moves at players that turned red or yellow | v1.2+ |
| Simple gap vs. stock prices | Market-cap decline is treated directly as the loss priced in by the market | Replace with the AI basket's excess decline and default probabilities backed out of bond spreads | v1.1 |
| Fixed shock time profile | Every shock builds linearly over four quarters; sudden shocks (defaults) and gradual ones (price declines) are treated alike | Parameterize the number of quarters to full effect for each shock | v1.1 |
| Treatment of component suppliers | Modeled as if they had purchase commitments with the labs, while in reality demand flows through hyperscaler capex | Calculate component revenue directly from capex paths × memory/chip shares | v2.0 |
| Not included | Taxes, working capital, FX, impairments, and hyperscalers' own funding (excluded because of their large legacy cushions) | Decide at the annual-model revision whether to add Meta and the hyperscalers' AI units to the funding layer | v2.0 |
Tuning works by logging "what we predicted last time (signals, risk points) and what actually happened" side by side for each run, and separating misses caused by inputs, by shock sizes, or by structure (formulas). The first two lead to minor revisions, the last to a major one.
Sources
The model's assumptions are based on pages 1 and 2 of this site and the public information and press reports cited there. Shock sizes and loss rates are v1.0 assumptions.
- 1. AI Circular Financing Map: estimates for the 14 companies, deal list, peripheral players, extended map (source data for the exposure table)
- 2. AI Ecosystem Cash Flow Model: consolidated CF model (Base, Bull, Bear), company CF models (⑨–⑭), KPIs and warning levels (source of Base inputs and monthly indicators)
- IMF, Global Financial Stability Report (October 2026): 14 circular deals, about $300bn of equity, about $650bn of debt and about $1.4tn of revenue commitments. Summary by TNW
- Reference for the stress test design: bank supervisory stress tests (scenarios × transmission × capital and liquidity adequacy) and the IMF GFSR's framing of wrong-way risk, applied to the circular structure of the AI ecosystem