AI Ecosystem Stress Test Results ST-2026Q3-01 (July–September 2026, Preliminary)
This is a preliminary release. July–September results for NVIDIA, CoreWeave and SoftBank are not yet reflected, and data coverage is about 70%. The full version (ST-2026Q3-02) will be published in late November 2026 and will replace the figures on this page. All figures are model estimates based on our own estimates and assumptions from public information, and are not investment advice. $bn = billions of US dollars.
Key findings
- The weak side is funding, not demand: Demand (S1) and price (S2) shocks stay at M3 even at L2. Credit market shutdown (S3) and a shorter GPU refresh cycle (S4) reach M4–M5 at L2.
- Current trends alone are M3: In a scenario that mildly extends current price declines and credit deterioration (S8), total impact is about $89bn. CoreWeave, the Stargate site SPVs, Oracle's AI unit and the neoclouds run out of cash, concentrated between October–December 2026 and January–March 2027.
- CoreWeave runs out of cash even without a shock: In Base its cash turns negative in April–June 2027, with a shortfall of about $7.5bn through July–September 2028. This matches the bond market, where its 2032 notes trade below 80.
- OpenAI and Anthropic stay green in every scenario: July–September revenue beat expectations, and cash on hand plus Anthropic's IPO proceeds (provisional) are ample. But dependence on payments from these two is concentrated in the supply-side players above.
- The combined scenario (S7) remains M5: Total impact is about $402bn, slightly better than about $419bn with the v1.0 default inputs. Oracle's equity raises and SoftBank's refinancing helped, while Oracle's higher capex made S4 worse.
- The gap versus markets: bonds agree, stocks reflect something else: Model expected losses are below 1% of each company's market cap. NVIDIA's 11% fall from its peak (about $550bn) cannot be explained by losses in the circular structure; we read it as a reassessment of growth and valuation multiples.
- The monthly checkpoint met the trigger for an ad hoc test: CP-2026-10 shows two reds and four yellows, and this run doubles as that ad hoc test.
Monthly checkpoint CP-2026-10
Two reds and four yellows. This meets the rule that one or more reds, or three or more yellows, trigger an ad hoc stress test. Demand-side indicators are green; the reds and yellows are concentrated in prices and credit.
| # | Leading indicator | This month | Yellow / red threshold | Signal | Basis |
|---|---|---|---|---|---|
| 1 | Tokens processed, year on year | 4.0× | 1.7 / 1.5× or below | Green | Google's first-party API volume up 4× year on year; OpenRouter flat |
| 2 | Annual decline in realized unit price | 50% | 35 / 50% or more | Red | Anthropic's token prices down about 50% year on year |
| 3 | GPU rental rate, 3-month change | +11% (est.) | −20 / −35% or below | Green | H100 index at $2.88, up 44% since December 2025 |
| 4 | AI-related credit spread change | About +350bp (est.) | 150 / 300bp or more | Red | Oracle CDS at 151bp; CoreWeave 2032 notes yielding about 15% |
| 5 | AI lab valuation in latest round vs. previous | 1.41× | 1.1 / 1.0× or below | Yellow (manual) | Value is green, but overridden because OpenAI shelved its 2026 IPO ("delay to plan") |
| 6 | Hyperscaler capex guidance revisions | 0% | −10 / −20% or below | Green | Microsoft, Alphabet, Amazon and Meta held or raised guidance |
| 7 | Share of cloud revenue from AI labs | 45% | 40 / 50% or more | Yellow | Estimated from lab dependence in Oracle's and CoreWeave's backlogs |
| 8 | DRAM contract prices, month on month | +4% | −10 / −20% or below | Green | Q4 contract price forecast of +10–15%, spread by month |
| 9 | AI stock basket, decline from peak | −20% (est.) | −20 / −30% or below | Yellow | SOX −13% in eight trading days, NVIDIA −11%, CoreWeave −24% in a week |
| 10 | Negative rating/lending events | 1 | 1 / 2 or more | Yellow | Oracle issued a force majeure notice on its Jupiter site (New Mexico) on September 24 |
"Est." values are converted from public data. Indicators 4 and 9 will be replaced with measured values in the full version. Indicator 5 is a manual override.
Magnitude by scenario
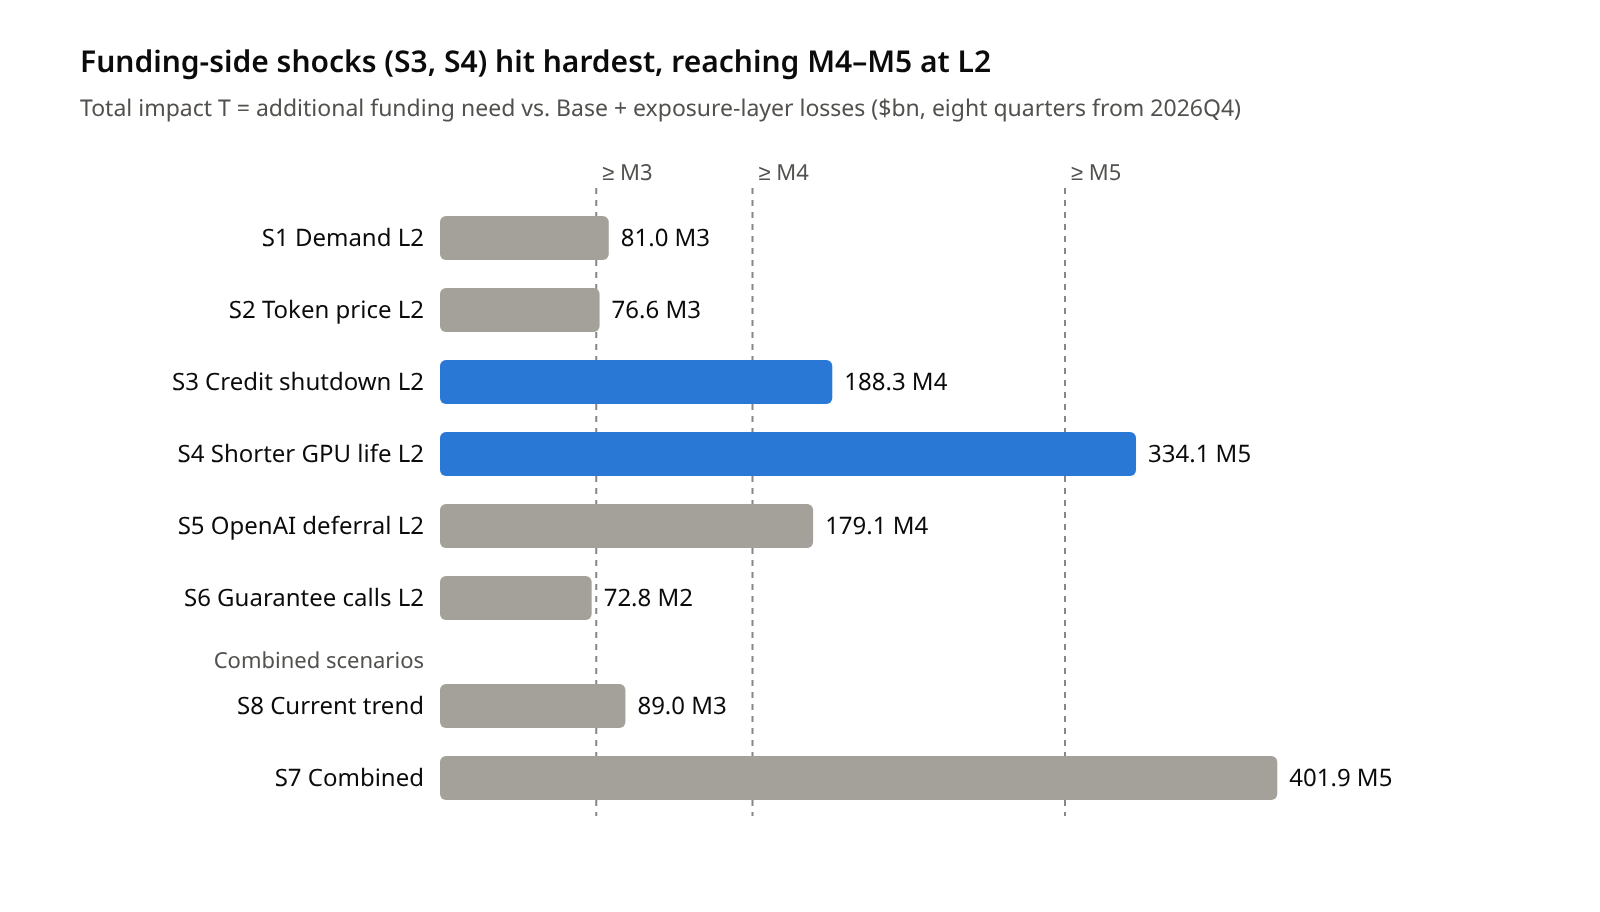
Demand (S1) and price (S2) shocks stay at M3 even at L2, because strong token volumes and capex guidance in July–September leave headroom on the demand side.
The heavy side is funding. If credit markets close for four quarters (S3-L2), four players (CoreWeave, the Stargate site SPVs, Oracle's AI unit and the neoclouds) run short of cash between October–December 2026 and January–March 2027. If the GPU refresh cycle shortens (S4-L2), extra capex adds SpaceXAI, turning five players red.
In no scenario do OpenAI or Anthropic newly turn red. The magnitude comes not from a lab failing but from cash shortfalls among those supplying compute to the labs, and from losses at their lenders and investors.
Risk points
Five of the nine funding-layer players show a signal. Each cell shows "shortfall ($bn) · first quarter cash turns negative." Yellow means cash remains but is below half of one quarter's outflow.
| Player | Base | S8 current trend | S3 credit L2 | S4 GPU refresh L2 | S7 combined |
|---|---|---|---|---|---|
| CoreWeave | Red 7.5 · 2027Q2 | Red 25.7 · 2026Q4 | Red 36.4 · 2026Q4 | Red 40.7 · 2026Q4 | Red 50.2 · 2026Q4 |
| Oracle (AI unit) | Yellow | Red 6.6 · 2027Q1 | Red 27.5 · 2027Q1 | Red 57.6 · 2027Q1 | Red 95.3 · 2026Q4 |
| Stargate site SPVs | Yellow | Red 5.4 · 2027Q1 | Red 21.3 · 2027Q1 | Red 30.5 · 2027Q1 | Red 34.0 · 2026Q4 |
| Neoclouds (aggregate) | Green | Red 3.2 · 2027Q1 | Red 17.6 · 2027Q1 | Red 20.2 · 2027Q2 | Red 25.6 · 2027Q1 |
| SpaceXAI | Green | Yellow | Green | Red 26.7 · 2028Q1 | Red 8.5 · 2028Q3 |
| OpenAI, Anthropic, SoftBank, Mistral | Green | Green | Green | Green | Green |
Quarters are calendar quarters; 2026Q4 means October–December 2026.
- CoreWeave is the first point of failure: Interest is about $0.9bn a quarter, and if new borrowing stops, cash runs out that quarter. Even in Base its funding assumes refinancing.
- Oracle's AI unit has the largest shortfall: Capex is $28.5bn a quarter and needs both bonds and equity (ATM). In S7, where both stop, the shortfall is $95.3bn.
- The Stargate site SPVs are exposed to timing gaps between site completion and OpenAI's payments: The force majeure notice at the Jupiter site widens that gap.
- SpaceXAI is vulnerable to higher capex: It expects $35–40bn of capex in October–December, and a faster GPU refresh would exhaust its cash in 2028.
Gap versus stock and bond markets
Model expected loss is the probability-weighted average of losses across scenarios, with Base 55%, light (S1-L1) 25%, medium (S7) 15% and severe (S3-L3) 5%. Market caps are as of July 14, 2026 and will be updated in the full version.
| Holder | Expected loss ($bn) | Market cap ($bn) | % of market cap | Market moves |
|---|---|---|---|---|
| Oracle | 5.3 | 614.6 | 0.86% | CDS at 151bp, highest since 2009; 2035 bond spread 187bp |
| Microsoft | 3.8 | 3,100 | 0.12% | Capex guidance held at about $175bn |
| Amazon | 2.1 | 2,600 | 0.08% | Trailing 12-month free cash flow −$42.4bn |
| NVIDIA | 1.7 | 5,000 | 0.03% | Down 11% from peak (about $550bn) |
| Alphabet | 0.3 | 4,500 | 0.01% | Signaled a sharp increase in 2027 capex |
| SoftBank | 2.2 | n/a | — | Fell 11% on September 14 (OpenAI shelved its 2026 IPO) |
| CoreWeave | 0.3 (holdings) | n/a | — | Down 24% in a week; 2032 notes below 80 (yield about 15%). Own shortfall shown above |
- Stocks are pricing in far larger declines than losses in the circular structure: NVIDIA's fall is about 300 times the model's expected loss. It is better read as a reassessment of future growth and valuation multiples, and of the capital constraints flagged by Broadcom CEO Hock Tan.
- Bonds are watching the same places as the model: Bond yields and CDS are rising at CoreWeave and Oracle's AI unit, the players the model flags red. On where company-level risk sits, the model and the market agree.
- The gap does not mean the market is wrong: The model measures only losses arising from equity, purchase commitments, loans and guarantees, not lower future profits from lost orders. For the full version we will consider adding a column that converts backlog (RPO) declines into profit.
In S7, the holders with the largest losses are Oracle ($33.1bn), Microsoft ($25.0bn), private credit (Blackstone, Blue Owl and others, $18.2bn), bond investors ($15.1bn) and Apollo and others ($14.0bn).
Items to watch
| When | Event | What to look for | Related shocks |
|---|---|---|---|
| Week of Nov 9 | Anthropic IPO pricing | Amount raised (model assumes $30bn) and valuation; a test of labs' access to capital markets | S3, S5 |
| Nov 10 | CoreWeave Jul–Sep results | Refinancing and new borrowing, interest vs. EBITDA, 2027 funding plan | Red in Base, S3 |
| Mid-November | SoftBank Jul–Sep results | Remaining bridge loan, margin loans, collateral value of OpenAI stake | S3 |
| Nov 19 | NVIDIA Aug–Oct results | Data center revenue, customer concentration, disclosure of lease guarantees and investments | S1, S6 |
| Late November | Full version ST-2026Q3-02 | Recalculation reflecting the four items above | All |
| Early December | Monthly checkpoint CP-2026-11 | Whether the reds in prices and credit persist for a second month | S2, S3 |
| Mid-December (expected) | Oracle FY27 Q2 results | Capex and free cash flow, continued ATM equity issuance, recovery at the Jupiter site | S3, S4 |
| Ongoing | OpenAI's next round and IPO timing | Whether valuation holds; payment schedules to Oracle, Azure and AWS | S5 |
| Ongoing | Oracle CDS, CoreWeave 2032 notes | Whether Oracle CDS exceeds 200bp or CoreWeave notes fall below 70 | S3 |
Oracle CDS at 200bp and CoreWeave notes at 70 are markers set for this run. If either is crossed, we will run an ad hoc test with S3 raised to L2.
Input updates and provisional items
The model structure is unchanged from v1.0; only inputs were replaced with July–September 2026 disclosures. Amounts are annual.
| Player | Main updates | Basis |
|---|---|---|
| OpenAI | Revenue raised to $44bn (2026), $85bn (2027) and $125bn (2028) | Revenue run rate about $70bn (September); April–June revenue $6.7bn |
| Anthropic | Revenue $53bn, $100bn and $140bn; IPO proceeds of $30bn assumed provisionally | July–September revenue $16.8bn, adjusted operating margin 11% |
| SpaceXAI | Revenue $25bn, capex $60bn; Apollo-led $40bn GPU financing booked as leases | AI unit July–September revenue $7.6bn; capex about $20bn a quarter |
| Oracle (AI unit) | Capex $95bn, higher interest; $5bn a quarter of ATM equity added | FY27 Q1: capex $28.5bn, free cash flow −$5.4bn, backlog $664bn |
| CoreWeave | Debt of $51.6bn; interest raised to $3.6–5.0bn a year | Debt at end of June; July–September interest guidance $0.86–0.94bn |
| SoftBank | Partial refinancing of the bridge loan and new facility reflected | $25.9bn of the $40bn repaid; new $11.87bn facility |
Oracle's AI unit figures are estimates that allocate the AI share of company-wide disclosures. The aggregate neoclouds and Stargate site SPVs remain low-precision estimates based on press reports. The full version (ST-2026Q3-02) will replace the following provisional items.
- Results not yet reported: July–September figures for CoreWeave (Nov 10), SoftBank (mid-November) and NVIDIA (Nov 19).
- Provisional funding: Anthropic's IPO proceeds, and OpenAI's cash on hand and next round.
- Estimated monthly indicators: Credit spreads and the AI stock basket, to be replaced with measured values.
- Market caps: July 14 values updated to the latest, with SoftBank and CoreWeave added.
Sources
Figures are from press reports and analysis articles retrieved on November 2, 2026. Cross-checking against primary filings (earnings releases, SEC filings) will be done in the full version. For model definitions, see the stress test model v1.0.
- Anthropic revenue jumps 46% to $16.8bn (Euronews, October 15, 2026)
- OpenAI Q2 2026 revenue $6.7B (Crypto Briefing)
- OpenAI adds more consumer revenue in Q3 (ROIC.ai, September 29, 2026)
- Oracle Q1 FY2027 financial analysis (sec-api.io)
- Oracle stock fell on its Project Jupiter notice (TIKR)
- Oracle faces rising bond market stress (Cryptometer)
- CoreWeave shares and bonds slide as debt fears grip AI build (Let's Data Science)
- CoreWeave Q2 2026 revenue and debt (Runtime Wire)
- SoftBank shares fall after $11.87bn OpenAI loan (The Next Web)
- SoftBank shares plunge 11% as OpenAI abandons 2026 IPO timeline (Parameter)
- SpaceX locks in $40B GPU financing deal with Apollo (TechCrunch, October 26, 2026)
- Microsoft Q1: Azure up 48%, capex $39.4B (AI Weekly)
- Google Cloud revenue doubles as capex hits $51.4B (FourWeekMBA)
- AWS growth hits 39% in Q3 (AI Weekly)
- Meta Q3: capex outran cash by $2.1B (FourWeekMBA)
- H100 rent up 44% as Anthropic token prices halve (FourWeekMBA)
- The token state of play (OpenRouter)
- Broadcom falls as Hock Tan's capital warning hangs over AI chips (24/7 Wall St., October 16, 2026)
- Semiconductor stocks SOX losing streak (Stocktwits)
- DRAM and NAND price outlook (TrendForce)
- Largest companies by market cap (AlphaSense)